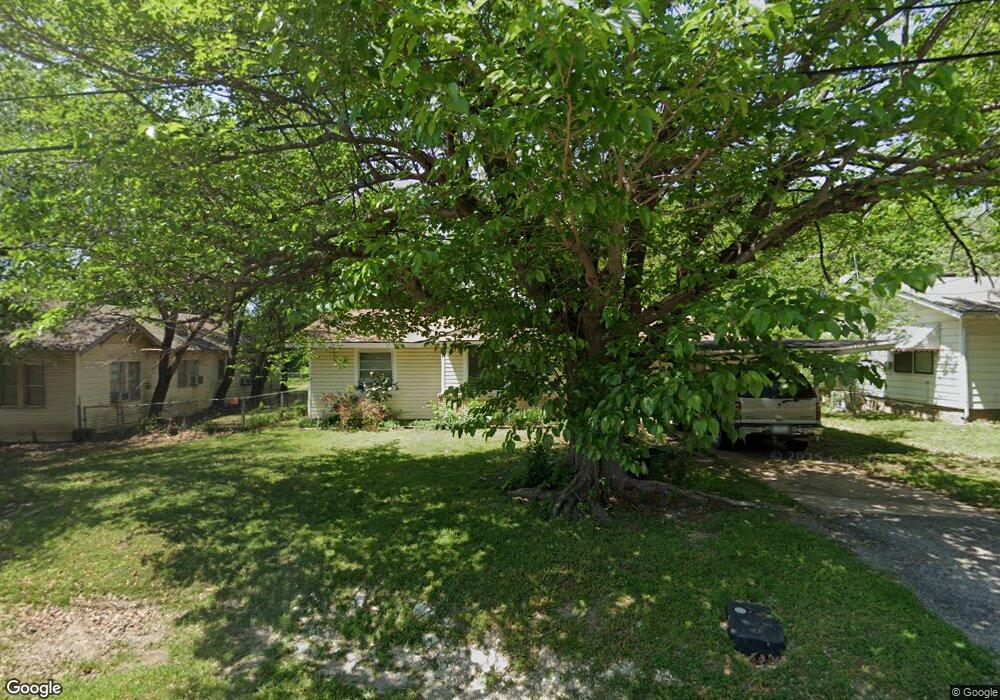
110 Sewell Ave Midlothian, TX 76065
Estimated Value: $207,413 - $225,000
3
Beds
1
Bath
1,104
Sq Ft
$196/Sq Ft
Est. Value
About This Home
This home is located at 110 Sewell Ave, Midlothian, TX 76065 and is currently estimated at $216,207, approximately $195 per square foot. 110 Sewell Ave is a home located in Ellis County with nearby schools including Irvin Elementary School and Frank Seale Middle School.
Ownership History
Date
Name
Owned For
Owner Type
Purchase Details
Closed on
Dec 29, 2006
Sold by
Weattherford Jimmy Lee
Bought by
Weatherford W E and Weatherford Ollie M
Current Estimated Value
Home Financials for this Owner
Home Financials are based on the most recent Mortgage that was taken out on this home.
Original Mortgage
$29,415
Outstanding Balance
$17,471
Interest Rate
6.1%
Mortgage Type
Future Advance Clause Open End Mortgage
Estimated Equity
$198,737
Create a Home Valuation Report for This Property
The Home Valuation Report is an in-depth analysis detailing your home's value as well as a comparison with similar homes in the area
Home Values in the Area
Average Home Value in this Area
Purchase History
| Date | Buyer | Sale Price | Title Company |
|---|---|---|---|
| Weatherford W E | -- | None Available |
Source: Public Records
Mortgage History
| Date | Status | Borrower | Loan Amount |
|---|---|---|---|
| Open | Weatherford W E | $29,415 |
Source: Public Records
Tax History Compared to Growth
Tax History
| Year | Tax Paid | Tax Assessment Tax Assessment Total Assessment is a certain percentage of the fair market value that is determined by local assessors to be the total taxable value of land and additions on the property. | Land | Improvement |
|---|---|---|---|---|
| 2025 | $227 | $124,230 | -- | -- |
| 2024 | $227 | $112,936 | -- | -- |
| 2023 | $227 | $102,669 | $0 | $0 |
| 2022 | $584 | $93,335 | $0 | $0 |
| 2021 | $2,041 | $84,850 | $26,250 | $58,600 |
| 2020 | $2,059 | $81,860 | $26,250 | $55,610 |
| 2019 | $2,065 | $78,850 | $0 | $0 |
| 2018 | $584 | $82,590 | $20,000 | $62,590 |
| 2017 | $1,966 | $75,850 | $20,000 | $55,850 |
| 2016 | $1,787 | $67,130 | $15,000 | $52,130 |
| 2015 | $657 | $61,290 | $15,000 | $46,290 |
| 2014 | $657 | $60,250 | $0 | $0 |
Source: Public Records
Map
Nearby Homes