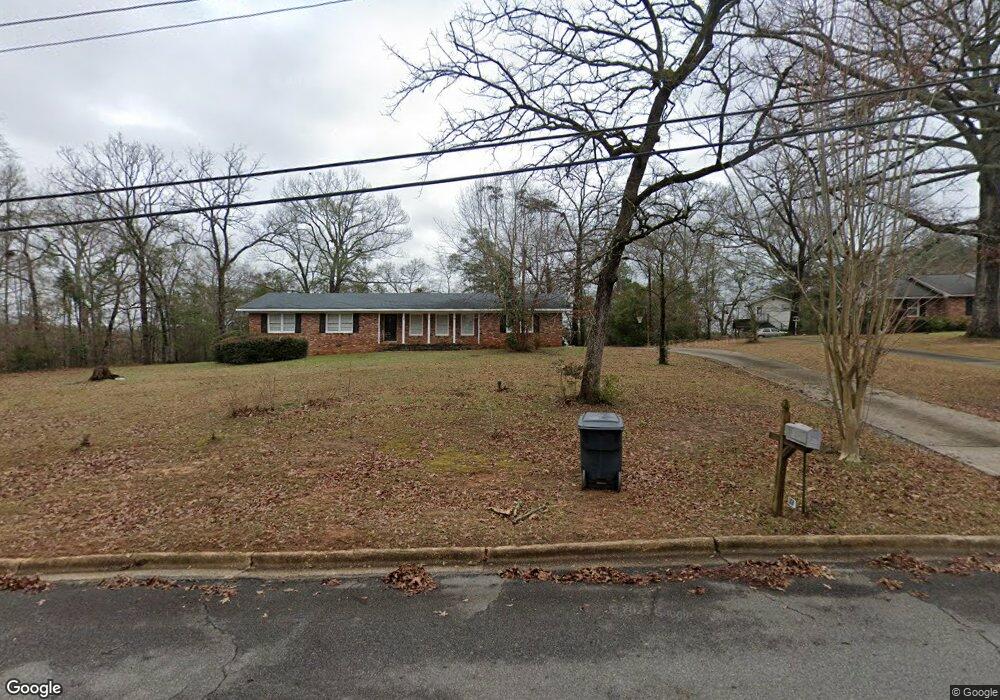
110 Sharon Cir Americus, GA 31709
Estimated Value: $147,000 - $202,000
4
Beds
2
Baths
1,666
Sq Ft
$104/Sq Ft
Est. Value
About This Home
This home is located at 110 Sharon Cir, Americus, GA 31709 and is currently estimated at $172,846, approximately $103 per square foot. 110 Sharon Cir is a home located in Sumter County with nearby schools including Sumter County Primary School, Sumter County Elementary School, and Sumter County Middle School.
Ownership History
Date
Name
Owned For
Owner Type
Purchase Details
Closed on
Jun 11, 2008
Sold by
Vandervoort Richard J
Bought by
Palmer Brandon J
Current Estimated Value
Home Financials for this Owner
Home Financials are based on the most recent Mortgage that was taken out on this home.
Original Mortgage
$115,200
Outstanding Balance
$72,322
Interest Rate
5.97%
Mortgage Type
New Conventional
Estimated Equity
$100,524
Purchase Details
Closed on
Jun 23, 2004
Sold by
Larson Martin C and Larson S
Bought by
Vandervoort Richard J
Purchase Details
Closed on
Dec 13, 2001
Sold by
Ross Clyde M and Ross R
Bought by
Larson Martin C and Larson S
Purchase Details
Closed on
Jun 28, 2001
Sold by
Marsyla Barbara J
Bought by
Ross Clyde M and Ross R
Purchase Details
Closed on
Jun 27, 1996
Sold by
Johnston Chris
Bought by
Marsyla Barbara J
Purchase Details
Closed on
Mar 1, 1990
Bought by
Johnston Chris
Purchase Details
Closed on
May 13, 1985
Bought by
Stewart Malone and Stewart D
Create a Home Valuation Report for This Property
The Home Valuation Report is an in-depth analysis detailing your home's value as well as a comparison with similar homes in the area
Purchase History
| Date | Buyer | Sale Price | Title Company |
|---|---|---|---|
| Palmer Brandon J | $144,000 | -- | |
| Vandervoort Richard J | $122,000 | -- | |
| Larson Martin C | $98,500 | -- | |
| Ross Clyde M | $92,500 | -- | |
| Marsyla Barbara J | $87,500 | -- | |
| Johnston Chris | -- | -- | |
| Stewart Malone | $8,500 | -- |
Source: Public Records
Mortgage History
| Date | Status | Borrower | Loan Amount |
|---|---|---|---|
| Open | Palmer Brandon J | $115,200 |
Source: Public Records
Tax History
| Year | Tax Paid | Tax Assessment Tax Assessment Total Assessment is a certain percentage of the fair market value that is determined by local assessors to be the total taxable value of land and additions on the property. | Land | Improvement |
|---|---|---|---|---|
| 2025 | $1,774 | $40,720 | $4,800 | $35,920 |
| 2024 | $1,774 | $40,720 | $4,800 | $35,920 |
| 2023 | $1,876 | $42,520 | $6,600 | $35,920 |
| 2022 | $1,285 | $42,520 | $6,600 | $35,920 |
| 2021 | $1,879 | $42,520 | $6,600 | $35,920 |
| 2020 | $1,924 | $42,520 | $6,600 | $35,920 |
| 2019 | $2,035 | $42,520 | $6,600 | $35,920 |
| 2018 | $1,337 | $42,520 | $6,600 | $35,920 |
| 2017 | $1,337 | $42,520 | $6,600 | $35,920 |
| 2016 | $1,879 | $42,520 | $6,600 | $35,920 |
| 2015 | $1,509 | $49,280 | $6,600 | $42,680 |
| 2014 | $1,511 | $49,280 | $6,600 | $42,680 |
| 2013 | -- | $49,280 | $6,600 | $42,680 |
Source: Public Records
Map
Nearby Homes
- 401 Rigas Rd
- TBD Hillside Dr
- 1302 Crawford St
- 433 Mayo St
- 113 Clearview Cir
- 189 Briarwood Cir
- 1720 E Lamar St
- 333 Academy St
- 122 Southland Ridge Dr
- 621 E Church St
- 211 Horne St
- 213 Mitchell St
- 310 Tabby Ln
- 316 Taylor St
- 111 Cedar Ridge Dr
- 305 E Church St
- 620 E Furlow St
- Lots 5 6 13 14 Hwy 49n
- 604 A-C Ga Hwy 49s
- 253 Ga Hwy 27e
Your Personal Tour Guide
Ask me questions while you tour the home.