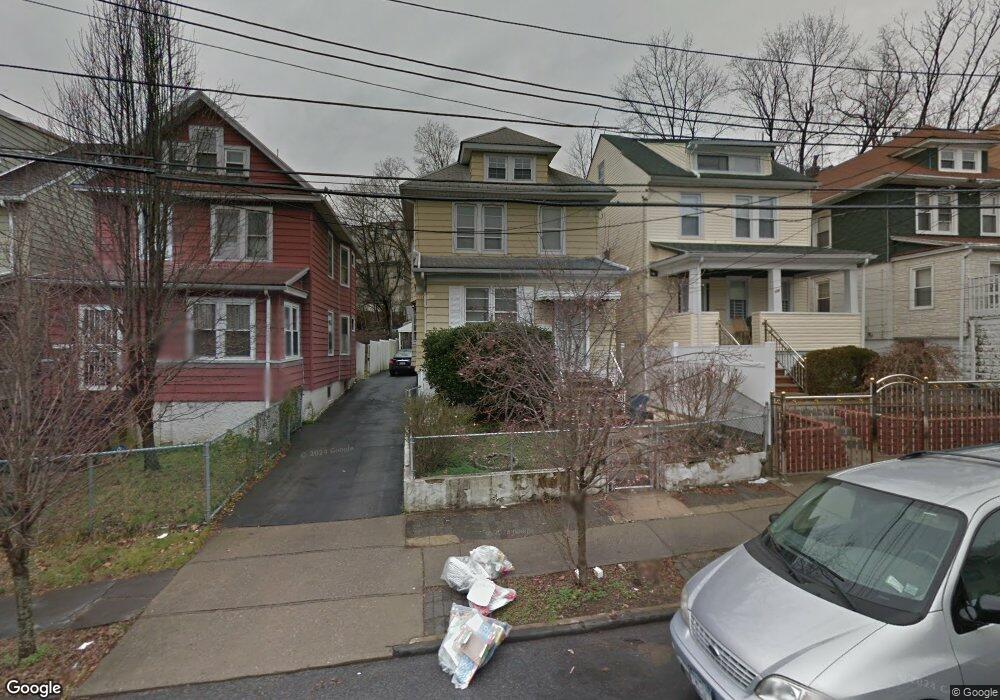
110 Sherman Ave Staten Island, NY 10301
Saint George NeighborhoodEstimated Value: $528,000 - $628,000
4
Beds
2
Baths
2,000
Sq Ft
$285/Sq Ft
Est. Value
About This Home
This home is located at 110 Sherman Ave, Staten Island, NY 10301 and is currently estimated at $569,375, approximately $284 per square foot. 110 Sherman Ave is a home located in Richmond County with nearby schools including P.S. 16 John J Driscoll, Fort Hill Collaborative Elementary, and P.S. 74 Future Leaders Elementary School.
Ownership History
Date
Name
Owned For
Owner Type
Purchase Details
Closed on
Mar 12, 2008
Sold by
Rosado Luz
Bought by
Jones Jean Marc Antoine V and Jones Jean Deana N
Current Estimated Value
Home Financials for this Owner
Home Financials are based on the most recent Mortgage that was taken out on this home.
Original Mortgage
$374,737
Outstanding Balance
$240,382
Interest Rate
6.3%
Mortgage Type
VA
Estimated Equity
$328,993
Purchase Details
Closed on
Sep 6, 1996
Sold by
Perrine Carlo J
Bought by
Rosado Luz
Home Financials for this Owner
Home Financials are based on the most recent Mortgage that was taken out on this home.
Original Mortgage
$121,250
Interest Rate
7.89%
Create a Home Valuation Report for This Property
The Home Valuation Report is an in-depth analysis detailing your home's value as well as a comparison with similar homes in the area
Home Values in the Area
Average Home Value in this Area
Purchase History
| Date | Buyer | Sale Price | Title Company |
|---|---|---|---|
| Jones Jean Marc Antoine V | $374,400 | None Available | |
| Rosado Luz | $125,000 | -- |
Source: Public Records
Mortgage History
| Date | Status | Borrower | Loan Amount |
|---|---|---|---|
| Open | Jones Jean Marc Antoine V | $374,737 | |
| Previous Owner | Rosado Luz | $121,250 |
Source: Public Records
Tax History Compared to Growth
Tax History
| Year | Tax Paid | Tax Assessment Tax Assessment Total Assessment is a certain percentage of the fair market value that is determined by local assessors to be the total taxable value of land and additions on the property. | Land | Improvement |
|---|---|---|---|---|
| 2025 | $4,398 | $34,320 | $7,547 | $26,773 |
| 2024 | $4,398 | $35,040 | $6,974 | $28,066 |
| 2023 | $4,443 | $21,876 | $5,975 | $15,901 |
| 2022 | $4,338 | $37,320 | $11,160 | $26,160 |
| 2021 | $4,314 | $32,940 | $11,160 | $21,780 |
| 2020 | $4,094 | $28,440 | $11,160 | $17,280 |
| 2019 | $3,817 | $24,720 | $11,160 | $13,560 |
| 2018 | $3,716 | $18,230 | $9,944 | $8,286 |
| 2017 | $3,691 | $18,107 | $8,636 | $9,471 |
| 2016 | $3,415 | $17,083 | $8,900 | $8,183 |
| 2015 | $2,918 | $16,117 | $8,011 | $8,106 |
| 2014 | $2,918 | $15,206 | $7,063 | $8,143 |
Source: Public Records
Map
Nearby Homes
- 80 Corson Ave
- 416 Westervelt Ave
- 97 Victory Blvd
- 50 Brook St
- 96 Victory Blvd
- 94 Victory Blvd
- 19 Scribner Ave
- 32 Scribner Ave
- 65 Brook St
- 78 Victory Blvd
- 9-11 Corson Ave
- 47,49 Tompkins Cir
- 47 Tompkins Cir
- 344 Westervelt Ave
- 27 Tompkins Cir
- 109 Monroe Ave
- 12 Saint Pauls Ave
- 103 Monroe Ave
- 130 Montgomery Ave
- 99 Monroe Ave
- 108 Sherman Ave
- 114 Sherman Ave
- 116 Sherman Ave
- 104 Sherman Ave
- 118 Sherman Ave
- 102 Sherman Ave
- 71 Corson Ave
- 71 Corson Ave Unit 2
- 98 Sherman Ave
- 401 Westervelt Ave
- 120 Sherman Ave
- 397 Westervelt Ave
- 69 Corson Ave
- 395 Westervelt Ave
- 393 Westervelt Ave
- 73 Corson Ave
- 96 Sherman Ave
- 407 Westervelt Ave
- 409 Westervelt Ave
- 403 Westervelt Ave