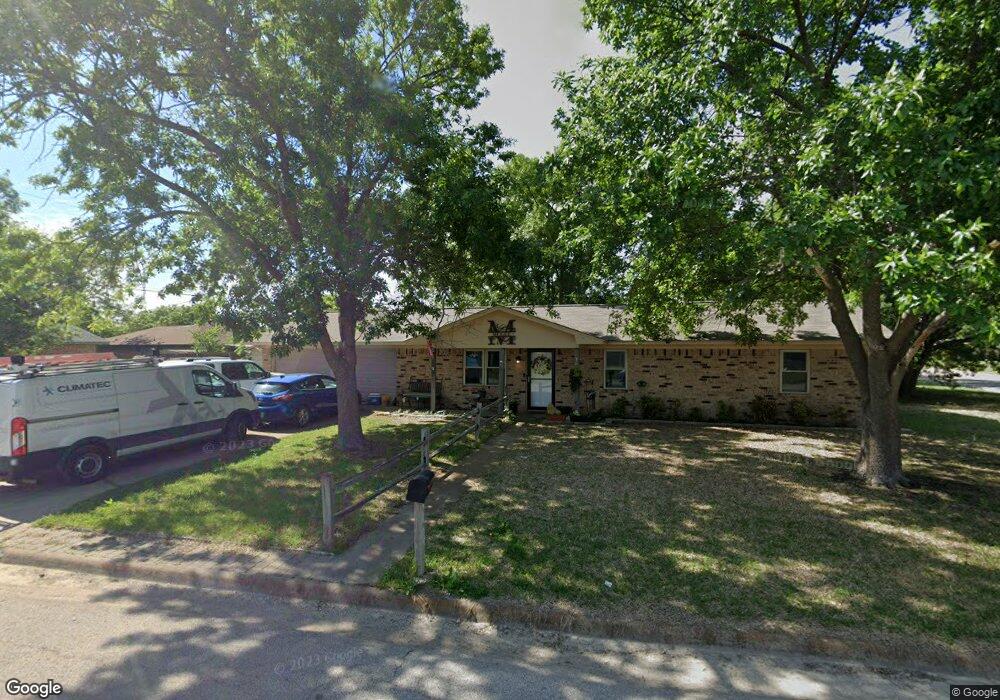
110 Southland Dr Sanger, TX 76266
Estimated Value: $236,274 - $272,000
3
Beds
2
Baths
1,280
Sq Ft
$197/Sq Ft
Est. Value
About This Home
This home is located at 110 Southland Dr, Sanger, TX 76266 and is currently estimated at $252,569, approximately $197 per square foot. 110 Southland Dr is a home located in Denton County with nearby schools including Chisholm Trail Elementary School, Clear Creek Intermediate School, and Sanger Sixth Grade Campus.
Ownership History
Date
Name
Owned For
Owner Type
Purchase Details
Closed on
Dec 7, 2010
Sold by
Us Bank National Association
Bought by
Karvouniaris John
Current Estimated Value
Purchase Details
Closed on
Nov 22, 2010
Sold by
Green Elizabeth and Green Danny
Bought by
U S Bank National Association
Purchase Details
Closed on
Apr 7, 2004
Sold by
Weaver Joseph D and Weaver Katie Jo
Bought by
Green Elizabeth
Home Financials for this Owner
Home Financials are based on the most recent Mortgage that was taken out on this home.
Original Mortgage
$80,750
Interest Rate
9.75%
Mortgage Type
Purchase Money Mortgage
Purchase Details
Closed on
Jan 31, 2001
Sold by
Mutual Home Equity Fund Ii
Bought by
Weaver Joseph D and Weaver Katie Jo
Home Financials for this Owner
Home Financials are based on the most recent Mortgage that was taken out on this home.
Original Mortgage
$88,511
Interest Rate
7.13%
Purchase Details
Closed on
Sep 5, 2000
Sold by
Hudson Ranald D and Hudson Jonneta D
Bought by
Mutual Home Equity Fund Ii
Create a Home Valuation Report for This Property
The Home Valuation Report is an in-depth analysis detailing your home's value as well as a comparison with similar homes in the area
Home Values in the Area
Average Home Value in this Area
Purchase History
| Date | Buyer | Sale Price | Title Company |
|---|---|---|---|
| Karvouniaris John | -- | Lsi Title Agency Inc | |
| U S Bank National Association | $64,654 | None Available | |
| Green Elizabeth | -- | -- | |
| Weaver Joseph D | -- | -- | |
| Mutual Home Equity Fund Ii | $57,875 | -- |
Source: Public Records
Mortgage History
| Date | Status | Borrower | Loan Amount |
|---|---|---|---|
| Previous Owner | Green Elizabeth | $80,750 | |
| Previous Owner | Weaver Joseph D | $88,511 |
Source: Public Records
Tax History Compared to Growth
Tax History
| Year | Tax Paid | Tax Assessment Tax Assessment Total Assessment is a certain percentage of the fair market value that is determined by local assessors to be the total taxable value of land and additions on the property. | Land | Improvement |
|---|---|---|---|---|
| 2025 | $3,355 | $161,000 | $72,938 | $88,062 |
| 2024 | $3,355 | $166,000 | $72,938 | $93,062 |
| 2023 | $3,648 | $180,000 | $52,340 | $127,660 |
| 2022 | $3,681 | $166,000 | $54,704 | $111,296 |
| 2021 | $2,858 | $136,000 | $35,101 | $100,899 |
| 2020 | $2,943 | $133,000 | $35,101 | $97,899 |
| 2019 | $2,732 | $120,000 | $35,101 | $84,899 |
| 2018 | $2,220 | $97,000 | $25,072 | $71,928 |
| 2017 | $2,185 | $95,000 | $25,072 | $69,928 |
| 2016 | $2,175 | $75,000 | $14,588 | $60,412 |
| 2015 | $1,371 | $62,000 | $14,588 | $47,412 |
| 2014 | $1,371 | $59,000 | $19,155 | $39,845 |
| 2013 | -- | $53,310 | $19,155 | $34,155 |
Source: Public Records
Map
Nearby Homes
- 202 Southland Dr
- 209 Southland Dr
- 226 Hillcrest St
- 130 Southside Dr
- 2000 S Stemmons St
- 212 Diane Dr
- 321 Quail Crossing Dr
- 319 Quail Crossing Dr
- 2004 S Stemmons St
- 113 Diane Dr
- 124 Morning Glory
- 109 Colonial Heights
- 114 Pintail Ln
- 117 Teal Rd
- 108 Magnolia Dr
- 505 Houston St
- 185 Aster Dr
- 942 First St
- 141 Shady Grove Dr
- 936 First St
- 104 Southmeadow Dr
- 106 Southland Dr
- 109 Southland Dr
- 103 Southside Dr
- 111 Southland Dr Unit A
- 106 Southmeadow Dr
- 107 Southland Dr
- 105 Southside Dr
- 201 Southland Dr
- 204 Southland Dr
- 108 Southmeadow Dr
- 107 Southside Dr
- 105 Southland Dr
- 101 Southmanor Ct
- 203 Southland Dr
- 206 Southland Dr
- 110 Southmeadow Dr
- 109 Southside Dr
- 103 Southmanor Ct
- 103 Southland Dr