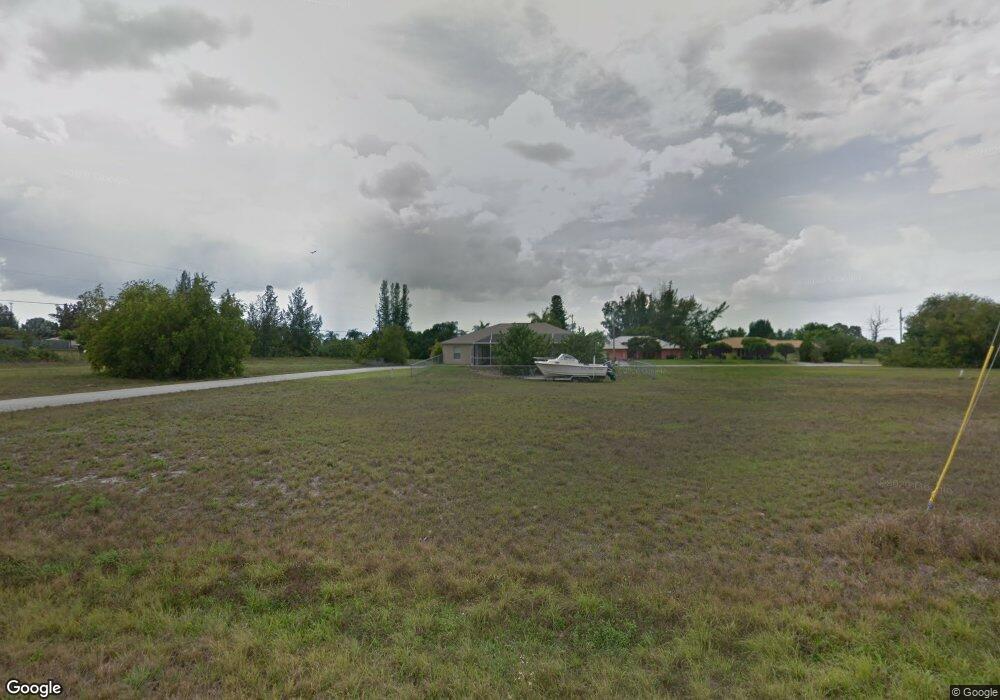
110 SW 21st Place Cape Coral, FL 33991
Mariner NeighborhoodEstimated Value: $282,905 - $344,000
3
Beds
2
Baths
1,298
Sq Ft
$234/Sq Ft
Est. Value
About This Home
This home is located at 110 SW 21st Place, Cape Coral, FL 33991 and is currently estimated at $303,226, approximately $233 per square foot. 110 SW 21st Place is a home with nearby schools including Caloosa Elementary School, Tropic Isles Elementary School, and J. Colin English Elementary School.
Ownership History
Date
Name
Owned For
Owner Type
Purchase Details
Closed on
Aug 29, 2019
Sold by
Habitat For Humanity Of Lee & Hendry Cou
Bought by
Quintana Ivan and Arias Maria Elena Paredcs
Current Estimated Value
Home Financials for this Owner
Home Financials are based on the most recent Mortgage that was taken out on this home.
Original Mortgage
$113,766
Interest Rate
3.7%
Mortgage Type
New Conventional
Purchase Details
Closed on
Jun 5, 2015
Sold by
Big Marlin Properties Llc
Bought by
Habitat For Humanity Of Lee & Hendry Cou
Purchase Details
Closed on
Oct 30, 2012
Sold by
Ballhagen Jay T T
Bought by
Big Martin Properties Llc
Purchase Details
Closed on
Jul 5, 2002
Sold by
Ballhagen Jay T and Ballhagen Melba E
Bought by
Ballhagen Jay T
Purchase Details
Closed on
Jul 14, 1998
Sold by
Bobker Pamela Ballhagen
Bought by
Ballhagen Jay T
Purchase Details
Closed on
Jul 2, 1998
Sold by
Ballhagen Craig
Bought by
Ballhagen Jay T
Create a Home Valuation Report for This Property
The Home Valuation Report is an in-depth analysis detailing your home's value as well as a comparison with similar homes in the area
Home Values in the Area
Average Home Value in this Area
Purchase History
| Date | Buyer | Sale Price | Title Company |
|---|---|---|---|
| Quintana Ivan | $155,000 | Omega Land Title Llc | |
| Habitat For Humanity Of Lee & Hendry Cou | $23,400 | Omega Title Llc | |
| Big Martin Properties Llc | $4,200 | None Available | |
| Ballhagen Jay T | -- | -- | |
| Ballhagen Jay T | -- | -- | |
| Ballhagen Jay T | -- | -- |
Source: Public Records
Mortgage History
| Date | Status | Borrower | Loan Amount |
|---|---|---|---|
| Previous Owner | Quintana Ivan | $113,766 |
Source: Public Records
Tax History Compared to Growth
Tax History
| Year | Tax Paid | Tax Assessment Tax Assessment Total Assessment is a certain percentage of the fair market value that is determined by local assessors to be the total taxable value of land and additions on the property. | Land | Improvement |
|---|---|---|---|---|
| 2025 | $2,622 | $157,429 | -- | -- |
| 2024 | $2,499 | $152,992 | -- | -- |
| 2023 | $2,499 | $148,536 | $0 | $0 |
| 2022 | $2,296 | $144,210 | $0 | $0 |
| 2021 | $2,293 | $148,072 | $29,807 | $118,265 |
| 2020 | $2,236 | $138,077 | $13,600 | $124,477 |
| 2019 | $131 | $17,000 | $17,000 | $0 |
| 2018 | $323 | $20,500 | $20,500 | $0 |
| 2017 | $292 | $8,000 | $8,000 | $0 |
| 2016 | $268 | $8,000 | $8,000 | $0 |
| 2015 | $363 | $6,800 | $6,800 | $0 |
| 2014 | $362 | $5,922 | $5,922 | $0 |
| 2013 | -- | $4,800 | $4,800 | $0 |
Source: Public Records
Map
Nearby Homes
- 106 SW 21st Place
- 36 SW 21st Ave Unit 30
- 26 SW 21st Place
- 2005 SW 2nd St
- 2529 SW 1st Terrace
- 2525 SW 1st Terrace
- 2514 SW 1st Terrace
- 2436 SW 1st Terrace
- 27 SW 22nd Ct
- 2202 SW 2nd Terrace
- 2123 SW Embers Terrace
- 2227 SW 2nd Terrace
- 2257 SW 2nd Terrace
- 2104 Embers Pkwy W
- 1914 SW 1st St
- 2216 SW 3rd Terrace
- 1912 SW 3rd Terrace
- 2237 SW 1st St
- 1907 SW 2nd St
- 2016 SW 3rd Terrace
- 121 SW 22nd Ave
- 117 SW 22nd Ave
- 102 SW 21st Place
- 2124 SW 2nd St Unit 30
- 2112 SW 2nd St
- 103 SW 21st Place
- 2128 SW 2nd St
- 37 SW 21st Place
- 2105 SW 2nd St
- 122 SW 22nd Ave
- 107 SW 21st Place
- 118 SW 22nd Ave
- 34 SW 21st Place
- 105 SW 22nd Ave
- 114 SW 22nd Ave
- 40 SW 21st Ave
- 2102 SW 2nd St
- 30 SW 21st Place
- 2015 SW 2nd St
- 2012 SW 1st St