
Landlord's Agent in 2025
Stephanie Zaqqout
NextHome Treasure Coast
(772) 419-0400
2 in this area
59 Total Sales
Estimated Value: $352,146 - $540,000
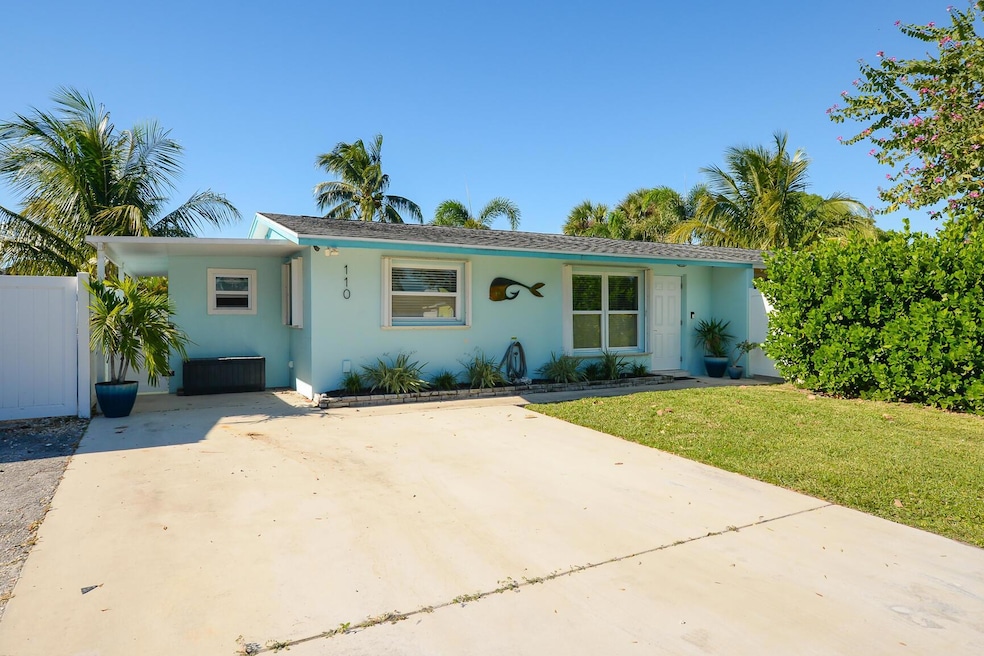
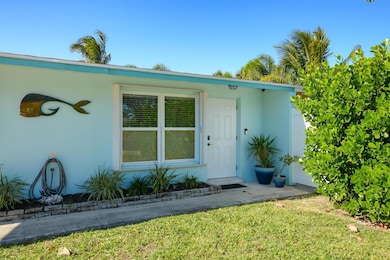
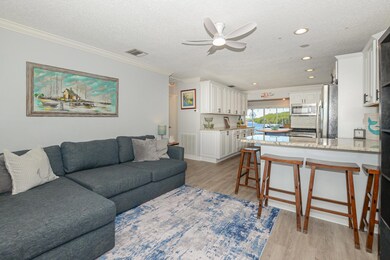
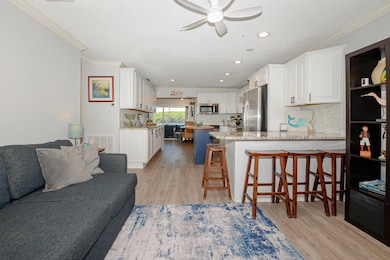
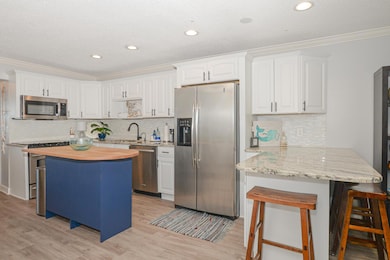
2/1.5 Waterfront Seasonal Rental. Ocean Access with Dock. NO HOA so bring your boat or just relax and enjoy the river views in the hot tub. Minutes to downtown Stuart, shops, restaurants, beaches and entertainment.
Last Agent to Rent the Property
NextHome Treasure Coast License #3369503 Listed on: 11/19/2025
| Date | Buyer | Sale Price | Title Company |
|---|---|---|---|
| Zaqqout Stephanie | $250,000 | Arrow Title Services Inc | |
| Zaqqout Stephanie | $250,000 | Arrow Title Services | |
| Austin Barbara A | $160,000 | First American Title Ins Co | |
| Gilbride Richard W | $71,400 | -- | |
| Austin Barbara A | $56,000 | -- |
| Date | Status | Borrower | Loan Amount |
|---|---|---|---|
| Open | Zaqqout Stephanie | $245,471 | |
| Closed | Zaqqout Stephanie | $245,471 | |
| Previous Owner | Austin Barbara A | $120,600 |
| Date | Event | Price | List to Sale | Price per Sq Ft |
|---|---|---|---|---|
| 12/08/2025 12/08/25 | Rented | $3,800 | 0.0% | -- |
| 11/19/2025 11/19/25 | For Rent | $3,800 | -- | -- |
| Year | Tax Paid | Tax Assessment Tax Assessment Total Assessment is a certain percentage of the fair market value that is determined by local assessors to be the total taxable value of land and additions on the property. | Land | Improvement |
|---|---|---|---|---|
| 2025 | $3,452 | $230,672 | -- | -- |
| 2024 | $3,371 | $224,172 | -- | -- |
| 2023 | $3,371 | $217,643 | $0 | $0 |
| 2022 | $3,245 | $211,304 | $0 | $0 |
| 2021 | $3,239 | $205,150 | $150,000 | $55,150 |
| 2020 | $3,674 | $192,010 | $135,000 | $57,010 |
| 2019 | $3,481 | $178,760 | $125,000 | $53,760 |
| 2018 | $3,384 | $175,650 | $125,000 | $50,650 |
| 2017 | $2,838 | $168,770 | $125,000 | $43,770 |
| 2016 | $3,183 | $169,440 | $130,000 | $39,440 |
| 2015 | $2,584 | $159,470 | $115,000 | $44,470 |
| 2014 | $2,584 | $139,880 | $95,000 | $44,880 |
Landlord's Agent in 2025
Stephanie Zaqqout
NextHome Treasure Coast
(772) 419-0400
2 in this area
59 Total Sales
N
Landlord's Co-Listing Agent in 2025
Nichole Kraum
NextHome Treasure Coast
(772) 528-2720
2 in this area
37 Total Sales
Tenant's Agent in 2025
Nancy Gagnon
Keyes Co
(800) 431-5509
1 Total Sale
Source: BeachesMLS (Greater Fort Lauderdale)
MLS Number: R11141882
APN: 16-38-41-008-000-00261-6
Disclaimer: Certain information contained herein is derived from information provided by parties other than Homes.com. All information provided is deemed reliable, but is not guaranteed to be accurate and should be independently verified.
![]() All listings featuring the BMLS logo are provided by Beaches MLS, Inc. This information is not verified for authenticity or accuracy and is not guaranteed. Copyright 2026 Beaches Multiple Listing Service, Inc. Information is provided exclusively for consumers' personal, non-commercial use and may not be used for any purpose other than to identify prospective properties consumers may be interested in purchasing.
All listings featuring the BMLS logo are provided by Beaches MLS, Inc. This information is not verified for authenticity or accuracy and is not guaranteed. Copyright 2026 Beaches Multiple Listing Service, Inc. Information is provided exclusively for consumers' personal, non-commercial use and may not be used for any purpose other than to identify prospective properties consumers may be interested in purchasing.
Ask me questions while you tour the home.