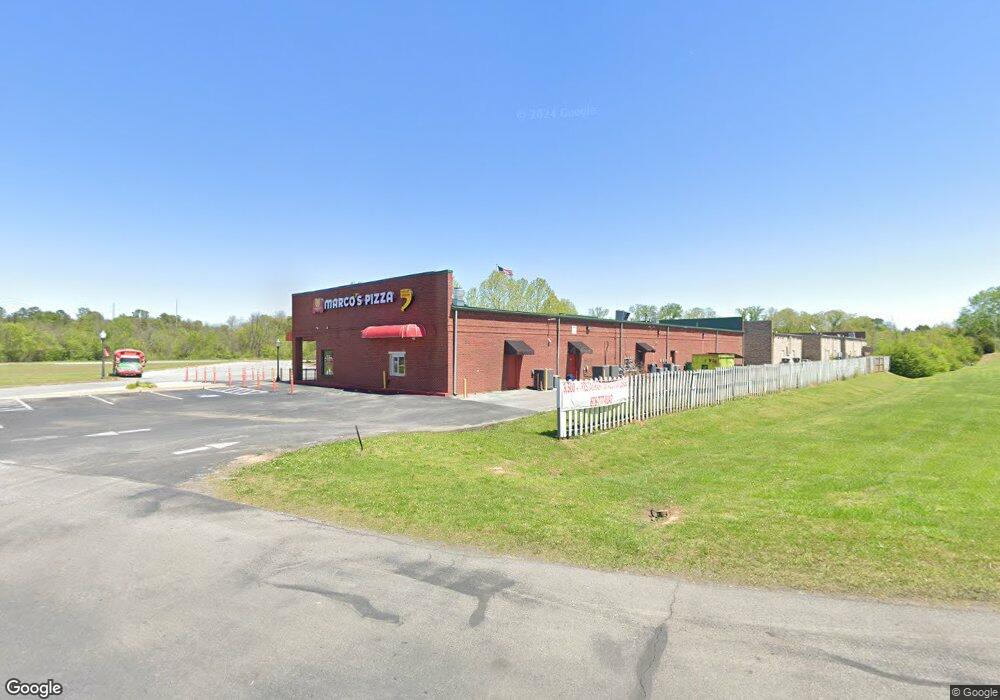
110 Sycamore Grove Ct Rockmart, GA 30153
Estimated Value: $373,014
--
Bed
--
Bath
7,604
Sq Ft
$49/Sq Ft
Est. Value
About This Home
This home is located at 110 Sycamore Grove Ct, Rockmart, GA 30153 and is currently estimated at $373,014, approximately $49 per square foot. 110 Sycamore Grove Ct is a home located in Polk County with nearby schools including Rockmart Middle School.
Ownership History
Date
Name
Owned For
Owner Type
Purchase Details
Closed on
Jun 6, 2019
Sold by
Yishi Llc
Bought by
D & M Rockmart Llc
Current Estimated Value
Home Financials for this Owner
Home Financials are based on the most recent Mortgage that was taken out on this home.
Original Mortgage
$91,600
Interest Rate
4.1%
Mortgage Type
Commercial
Purchase Details
Closed on
Sep 22, 2014
Sold by
Pyung Three Llc
Bought by
Yishi Llc
Home Financials for this Owner
Home Financials are based on the most recent Mortgage that was taken out on this home.
Original Mortgage
$170,000
Interest Rate
4.15%
Mortgage Type
Commercial
Purchase Details
Closed on
Jan 25, 2011
Sold by
Rbc Bank Usa Inc
Bought by
Pyung Three Llc
Purchase Details
Closed on
Jan 5, 2010
Sold by
Cmg Rentals Of Rockmart In
Bought by
Rbc Bank Usa
Purchase Details
Closed on
May 26, 2006
Sold by
Cmg Rentals Of Rockmart In
Bought by
Cmg Properties Inc
Purchase Details
Closed on
May 12, 2004
Sold by
All I Need Home Builders Inc
Bought by
Cmg Rentals Of Rockmart Inc
Create a Home Valuation Report for This Property
The Home Valuation Report is an in-depth analysis detailing your home's value as well as a comparison with similar homes in the area
Home Values in the Area
Average Home Value in this Area
Purchase History
| Date | Buyer | Sale Price | Title Company |
|---|---|---|---|
| D & M Rockmart Llc | $201,600 | -- | |
| Yishi Llc | $227,500 | -- | |
| Pyung Three Llc | $275,000 | -- | |
| Rbc Bank Usa | $408,908 | -- | |
| Cmg Properties Inc | $50,000 | -- | |
| Cmg Rentals Of Rockmart Inc | $141,500 | -- |
Source: Public Records
Mortgage History
| Date | Status | Borrower | Loan Amount |
|---|---|---|---|
| Closed | D & M Rockmart Llc | $91,600 | |
| Previous Owner | Yishi Llc | $170,000 |
Source: Public Records
Tax History Compared to Growth
Tax History
| Year | Tax Paid | Tax Assessment Tax Assessment Total Assessment is a certain percentage of the fair market value that is determined by local assessors to be the total taxable value of land and additions on the property. | Land | Improvement |
|---|---|---|---|---|
| 2024 | $3,899 | $136,906 | $73,732 | $63,174 |
| 2023 | $3,362 | $104,903 | $44,289 | $60,614 |
| 2022 | $2,436 | $102,661 | $43,299 | $59,362 |
| 2021 | $3,108 | $129,293 | $42,062 | $87,231 |
| 2020 | $3,115 | $129,293 | $42,062 | $87,231 |
| 2019 | $3,692 | $137,463 | $42,062 | $95,401 |
| 2018 | $3,788 | $137,463 | $42,062 | $95,401 |
| 2017 | $3,471 | $127,566 | $32,165 | $95,401 |
| 2016 | $3,471 | $127,566 | $32,165 | $95,401 |
| 2015 | $2,484 | $147,116 | $32,165 | $114,951 |
| 2014 | $4,045 | $147,116 | $32,165 | $114,951 |
Source: Public Records
Map
Nearby Homes
- 0 Nathan Dean Bypass Unit 10434274
- 0 Peachtree Rd Unit 19311295
- 307 & 309 Pine St
- 825 Wilson St
- 2470 Nathan Dean Pkwy
- 571 N Marble St
- 0 Nathan Dean Pkwy Unit 10366146
- 451 Clearwater St
- 2979 Nathan Dean Pkwy
- 00 Nathan Dean Pkwy
- 200 Litchfield St
- 222 Whitley Crossing
- 232 Litchfield St
- 367 Wingfoot St
- 530 Hogue Ave
- 247 Litchfield St
- 540 N Marble St
- 119 Pearl St
- 7667 Georgia 101
- 132 Highland Dr
- 0 Sycamore Grove Ct Unit 8442875
- 0 Sycamore Grove Ct
- 1051 Nathan Dean Bypass
- 150 Felton Dr
- 0 Rome Hwy
- 0 Rome Hwy Unit 3151938
- 0 Rome Hwy Unit 7298433
- 0 Rome Hwy Unit 7049991
- 0 Nathan Dean Bypass Unit 8446149
- 0 Nathan Dean Bypass Unit 3197222
- 0 Nathan Dean Bypass Unit 3273672
- 0 Nathan Dean Bypass Unit 7187568
- 0 Nathan Dean Bypass Unit 3163284
- 0 Nathan Dean Bypass Unit 3163274
- 0 Nathan Dean By Pass
- 0 Nathan Dean Bypass Unit 7249632
- 0 Nathan Dean Bypass Unit 7252636
- 0000 Nathan Dean Bypass
- 00 Nathan Dean Bypass
- 0 Nathan Dean Bypass