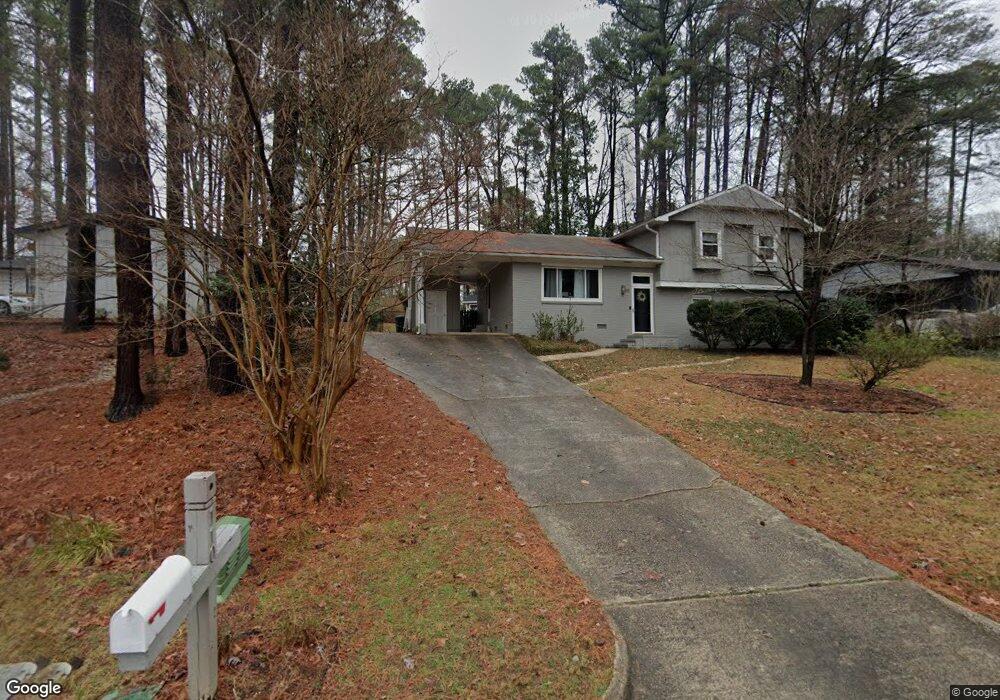
110 Sycamore St Cary, NC 27513
South Cary NeighborhoodEstimated Value: $454,000 - $563,000
3
Beds
3
Baths
2,030
Sq Ft
$248/Sq Ft
Est. Value
About This Home
This home is located at 110 Sycamore St, Cary, NC 27513 and is currently estimated at $503,833, approximately $248 per square foot. 110 Sycamore St is a home located in Wake County with nearby schools including Weatherstone Elementary School, East Cary Middle School, and Cary High School.
Ownership History
Date
Name
Owned For
Owner Type
Purchase Details
Closed on
Jun 30, 2020
Sold by
Holley Mark and Holley Christi
Bought by
Mess Michelle Anne and Turchi Ryan John
Current Estimated Value
Home Financials for this Owner
Home Financials are based on the most recent Mortgage that was taken out on this home.
Original Mortgage
$333,687
Outstanding Balance
$296,441
Interest Rate
3.2%
Mortgage Type
New Conventional
Estimated Equity
$207,392
Purchase Details
Closed on
Aug 15, 2019
Sold by
Bennett Jarietha N and Bennett Johnda N
Bought by
Holley Mark
Purchase Details
Closed on
Nov 29, 2003
Sold by
Bennett John N and Norman Brenda
Bought by
Norman Brenda
Home Financials for this Owner
Home Financials are based on the most recent Mortgage that was taken out on this home.
Original Mortgage
$105,000
Interest Rate
5.13%
Mortgage Type
Purchase Money Mortgage
Purchase Details
Closed on
Jan 1, 1975
Bought by
Norman Brenda
Create a Home Valuation Report for This Property
The Home Valuation Report is an in-depth analysis detailing your home's value as well as a comparison with similar homes in the area
Home Values in the Area
Average Home Value in this Area
Purchase History
| Date | Buyer | Sale Price | Title Company |
|---|---|---|---|
| Mess Michelle Anne | $352,000 | None Available | |
| Holley Mark | $210,000 | None Available | |
| Norman Brenda | -- | Title Source Inc | |
| Norman Brenda | $42,000 | -- |
Source: Public Records
Mortgage History
| Date | Status | Borrower | Loan Amount |
|---|---|---|---|
| Open | Mess Michelle Anne | $333,687 | |
| Previous Owner | Norman Brenda | $105,000 |
Source: Public Records
Tax History Compared to Growth
Tax History
| Year | Tax Paid | Tax Assessment Tax Assessment Total Assessment is a certain percentage of the fair market value that is determined by local assessors to be the total taxable value of land and additions on the property. | Land | Improvement |
|---|---|---|---|---|
| 2025 | $3,393 | $393,530 | $210,000 | $183,530 |
| 2024 | $3,320 | $393,530 | $210,000 | $183,530 |
| 2023 | $2,706 | $268,021 | $120,000 | $148,021 |
| 2022 | $2,605 | $268,021 | $120,000 | $148,021 |
| 2021 | $2,565 | $269,321 | $120,000 | $149,321 |
| 2020 | $2,516 | $262,745 | $120,000 | $142,745 |
| 2019 | $1,978 | $182,876 | $68,000 | $114,876 |
| 2018 | $1,857 | $182,876 | $68,000 | $114,876 |
| 2017 | $1,785 | $182,876 | $68,000 | $114,876 |
| 2016 | $1,758 | $182,876 | $68,000 | $114,876 |
| 2015 | $1,013 | $171,925 | $56,000 | $115,925 |
| 2014 | $1,615 | $171,925 | $56,000 | $115,925 |
Source: Public Records
Map
Nearby Homes
- 213 Howland Ave
- 117 Red Bud Ct
- 101 Murphy Dr
- 204 Phauff Ct
- 534 Matheson Place
- 316 Howland Ave
- 102 Joel Ct
- 101 Joel Ct
- 143 Hedgerow Ct
- 114 Canterfield Rd
- 710 Samuel Cary Dr
- 207 High House Rd
- 209 High House Rd
- 1009 Contessa Dr
- 1017 Frank Page Dr
- 1149 Contessa Dr
- 432 W Park St
- 418 Madison Ave
- 414 Madison Ave
- 415 W Chatham St
- 112 Sycamore St
- 106 Sycamore St
- 130 Sycamore St
- 102 Sycamore St
- 207 Howland Ave
- 209 Howland Ave
- 211 Howland Ave
- 113 Sycamore St
- 205 Howland Ave
- 109 Sycamore St
- 215 Howland Ave
- 107 Sycamore St
- 131 Sycamore St
- 105 Sycamore St
- 140 Sycamore St
- 103 Sycamore St
- 217 Howland Ave
- 201 Howland Ave
- 208 Howland Ave
- 129 Red Bud Ct