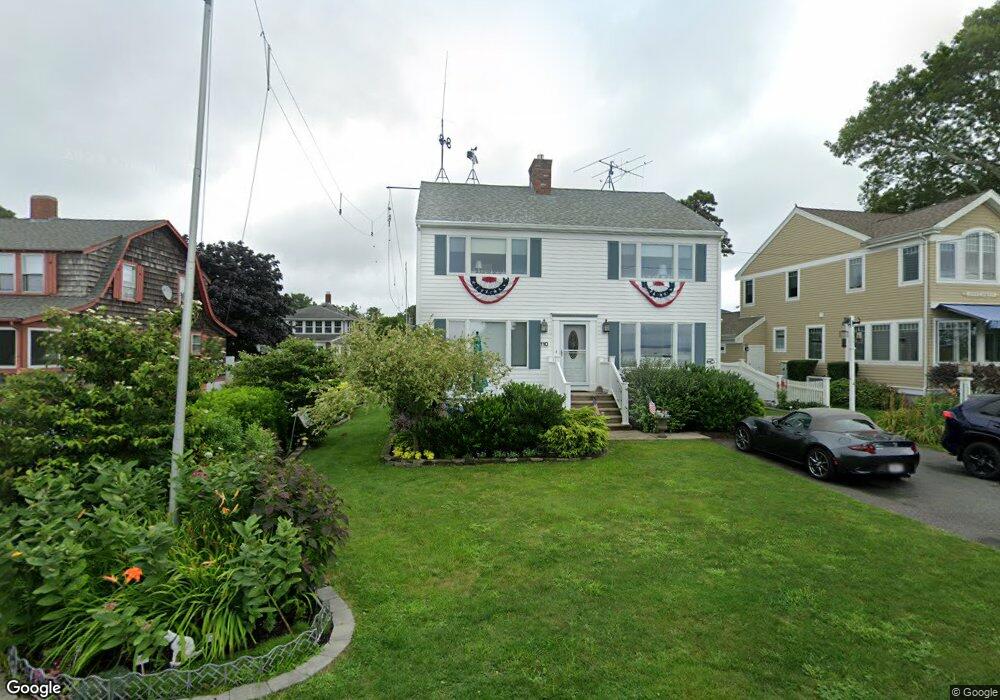
110 Tahanto Rd Pocasset, MA 02559
Estimated Value: $897,000 - $1,357,000
3
Beds
2
Baths
1,792
Sq Ft
$652/Sq Ft
Est. Value
About This Home
This home is located at 110 Tahanto Rd, Pocasset, MA 02559 and is currently estimated at $1,167,831, approximately $651 per square foot. 110 Tahanto Rd is a home located in Barnstable County with nearby schools including Bourne High School and Cadence Academy Preschool - Bourne.
Ownership History
Date
Name
Owned For
Owner Type
Purchase Details
Closed on
Mar 9, 2016
Sold by
Bresnahan Helen V and Bresnahan Charles E
Bought by
Bresnahan Irt and Bresnahan C E
Current Estimated Value
Purchase Details
Closed on
Jun 21, 2012
Sold by
Neal Nt and Neal
Bought by
Bresnahan Helen V and Bresnahan Charles E
Home Financials for this Owner
Home Financials are based on the most recent Mortgage that was taken out on this home.
Original Mortgage
$183,355
Interest Rate
3.84%
Mortgage Type
New Conventional
Create a Home Valuation Report for This Property
The Home Valuation Report is an in-depth analysis detailing your home's value as well as a comparison with similar homes in the area
Home Values in the Area
Average Home Value in this Area
Purchase History
| Date | Buyer | Sale Price | Title Company |
|---|---|---|---|
| Bresnahan Irt | -- | -- | |
| Bresnahan Irt | -- | -- | |
| Bresnahan Helen V | $488,500 | -- | |
| Bresnahan Helen | $488,500 | -- |
Source: Public Records
Mortgage History
| Date | Status | Borrower | Loan Amount |
|---|---|---|---|
| Previous Owner | Bresnahan Helen | $183,355 |
Source: Public Records
Tax History Compared to Growth
Tax History
| Year | Tax Paid | Tax Assessment Tax Assessment Total Assessment is a certain percentage of the fair market value that is determined by local assessors to be the total taxable value of land and additions on the property. | Land | Improvement |
|---|---|---|---|---|
| 2025 | $7,858 | $1,006,100 | $682,800 | $323,300 |
| 2024 | $7,684 | $958,100 | $650,200 | $307,900 |
| 2023 | $7,470 | $847,900 | $575,500 | $272,400 |
| 2022 | $7,045 | $698,200 | $509,300 | $188,900 |
| 2021 | $7,968 | $739,800 | $567,800 | $172,000 |
| 2020 | $7,807 | $726,900 | $562,300 | $164,600 |
| 2019 | $61 | $614,400 | $459,100 | $155,300 |
| 2018 | $65 | $587,100 | $437,300 | $149,800 |
| 2017 | $63 | $566,400 | $433,100 | $133,300 |
| 2016 | $5,727 | $563,700 | $433,100 | $130,600 |
| 2015 | $4,405 | $437,400 | $303,200 | $134,200 |
Source: Public Records
Map
Nearby Homes