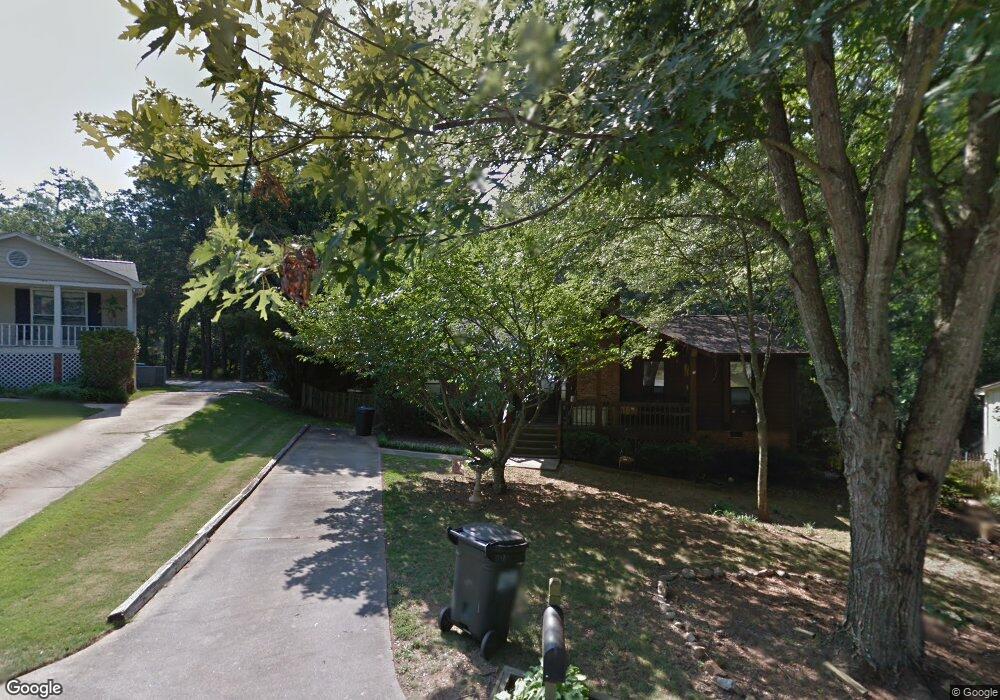
110 Tankersley Dr Simpsonville, SC 29681
Estimated Value: $253,682 - $278,000
3
Beds
2
Baths
1,344
Sq Ft
$197/Sq Ft
Est. Value
About This Home
This home is located at 110 Tankersley Dr, Simpsonville, SC 29681 and is currently estimated at $264,921, approximately $197 per square foot. 110 Tankersley Dr is a home located in Greenville County with nearby schools including Bethel Elementary School, Hillcrest Middle School, and Mauldin High School.
Ownership History
Date
Name
Owned For
Owner Type
Purchase Details
Closed on
Dec 29, 2020
Sold by
Merck Crystal
Bought by
Mikula Collin
Current Estimated Value
Home Financials for this Owner
Home Financials are based on the most recent Mortgage that was taken out on this home.
Original Mortgage
$169,750
Outstanding Balance
$151,476
Interest Rate
2.7%
Mortgage Type
New Conventional
Estimated Equity
$113,445
Purchase Details
Closed on
May 20, 2015
Sold by
Estate Of Karen Lynn Delamar and Merck Crystal
Bought by
Smith Elizabeth Leona
Purchase Details
Closed on
Apr 30, 2015
Sold by
Smith Elizabeth Leona
Bought by
Merck Crystal
Purchase Details
Closed on
May 16, 2006
Sold by
Delamar William David
Bought by
Delamar Karen Lynn
Home Financials for this Owner
Home Financials are based on the most recent Mortgage that was taken out on this home.
Original Mortgage
$86,000
Interest Rate
6.39%
Mortgage Type
Purchase Money Mortgage
Purchase Details
Closed on
Jan 20, 2000
Sold by
Tanahey Jill D
Bought by
Delamar Karen L
Create a Home Valuation Report for This Property
The Home Valuation Report is an in-depth analysis detailing your home's value as well as a comparison with similar homes in the area
Home Values in the Area
Average Home Value in this Area
Purchase History
| Date | Buyer | Sale Price | Title Company |
|---|---|---|---|
| Mikula Collin | $175,000 | None Available | |
| Smith Elizabeth Leona | -- | -- | |
| Merck Crystal | -- | -- | |
| Delamar Karen Lynn | -- | None Available | |
| Delamar Karen L | $97,500 | -- |
Source: Public Records
Mortgage History
| Date | Status | Borrower | Loan Amount |
|---|---|---|---|
| Open | Mikula Collin | $169,750 | |
| Previous Owner | Delamar Karen Lynn | $86,000 |
Source: Public Records
Tax History Compared to Growth
Tax History
| Year | Tax Paid | Tax Assessment Tax Assessment Total Assessment is a certain percentage of the fair market value that is determined by local assessors to be the total taxable value of land and additions on the property. | Land | Improvement |
|---|---|---|---|---|
| 2024 | $1,068 | $6,990 | $900 | $6,090 |
| 2023 | $1,068 | $6,990 | $900 | $6,090 |
| 2022 | $1,029 | $6,990 | $900 | $6,090 |
| 2021 | $694 | $4,650 | $740 | $3,910 |
| 2020 | $1,868 | $6,060 | $1,230 | $4,830 |
| 2019 | $1,834 | $6,060 | $1,230 | $4,830 |
| 2018 | $1,875 | $6,060 | $1,230 | $4,830 |
| 2017 | $1,847 | $6,060 | $1,230 | $4,830 |
| 2016 | $1,784 | $101,030 | $20,500 | $80,530 |
| 2015 | $1,786 | $101,030 | $20,500 | $80,530 |
| 2014 | -- | $102,230 | $18,500 | $83,730 |
Source: Public Records
Map
Nearby Homes
- 106 Clingmore Ct
- 1816 Bethel Rd
- 42 Carriage Run Dr
- 123 Ramble Rose Ct
- 401 Holland Rd
- 403 Holland Rd
- 9 Hollywoods Ln Unit B
- 206 Honey Horn Dr
- 201 Long Point Way
- 516 Bethel Dr
- 202 Mornington Ct
- 00 Holland Rd
- 57 Bay Springs Dr
- 615 Mount Sinai Ln
- 00 Bridges Rd
- 724 Elmbrook
- 405 Bass Harbor Ct
- 103 Ingrid Place
- 104 Shairpin Ln
- 907 Highway 14
- 108 Tankersley Dr
- 105 Lionel Ct
- 113 Tankersley Dr
- 111 Tankersley Dr
- 106 Tankersley Dr
- 103 Lionel Ct
- 109 Tankersley Dr
- 107 Tankersley Dr
- 104 Tankersley Dr
- 105 Tankersley Dr
- 1914 Bethel Rd
- 107 Lionel Ct
- 1916 Bethel Rd
- 1912 Bethel Rd
- 102 Tankersley Dr
- 204 Lancelot Dr
- 1910 Bethel Rd
- 103 Tankersley Dr
- 1918 Bethel Rd
- 302 Lancelot Dr