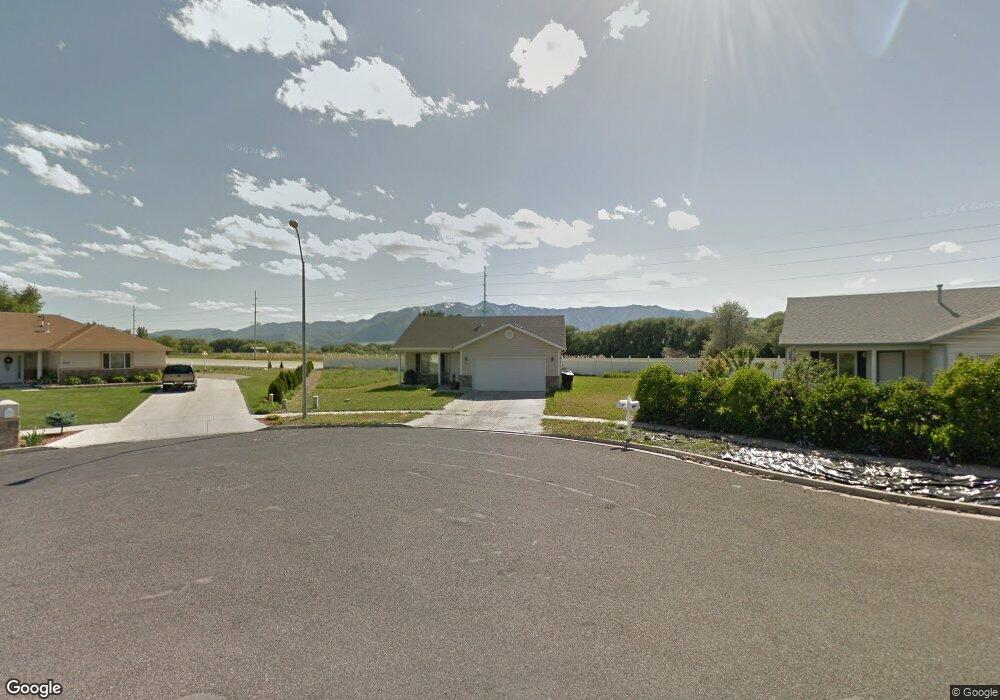
110 Teal Loop Logan, UT 84321
Woodruff NeighborhoodEstimated Value: $371,000 - $427,000
3
Beds
2
Baths
1,174
Sq Ft
$331/Sq Ft
Est. Value
About This Home
This home is located at 110 Teal Loop, Logan, UT 84321 and is currently estimated at $388,585, approximately $330 per square foot. 110 Teal Loop is a home located in Cache County with nearby schools including Woodruff School, Mount Logan Middle School, and Logan High School.
Ownership History
Date
Name
Owned For
Owner Type
Purchase Details
Closed on
Jan 4, 2016
Sold by
Gonzales Richard C and Gonzales Chelsea A
Bought by
Andrus Joshua D
Current Estimated Value
Home Financials for this Owner
Home Financials are based on the most recent Mortgage that was taken out on this home.
Original Mortgage
$158,332
Outstanding Balance
$124,999
Interest Rate
3.9%
Mortgage Type
VA
Estimated Equity
$263,586
Purchase Details
Closed on
Jun 16, 2005
Sold by
Taylor Jonathan R
Bought by
Gonzales Richard C and Gonzales Chelsea A
Home Financials for this Owner
Home Financials are based on the most recent Mortgage that was taken out on this home.
Original Mortgage
$85,000
Interest Rate
5.62%
Mortgage Type
New Conventional
Create a Home Valuation Report for This Property
The Home Valuation Report is an in-depth analysis detailing your home's value as well as a comparison with similar homes in the area
Home Values in the Area
Average Home Value in this Area
Purchase History
| Date | Buyer | Sale Price | Title Company |
|---|---|---|---|
| Andrus Joshua D | -- | Pinnacle Title | |
| Gonzales Richard C | -- | Hickman Land Title Company |
Source: Public Records
Mortgage History
| Date | Status | Borrower | Loan Amount |
|---|---|---|---|
| Open | Andrus Joshua D | $158,332 | |
| Previous Owner | Gonzales Richard C | $85,000 |
Source: Public Records
Tax History
| Year | Tax Paid | Tax Assessment Tax Assessment Total Assessment is a certain percentage of the fair market value that is determined by local assessors to be the total taxable value of land and additions on the property. | Land | Improvement |
|---|---|---|---|---|
| 2025 | $1,515 | $195,990 | $0 | $0 |
| 2024 | $157 | $196,505 | $0 | $0 |
| 2023 | $1,620 | $193,455 | $0 | $0 |
| 2022 | $1,454 | $162,105 | $0 | $0 |
| 2021 | $1,419 | $244,390 | $43,000 | $201,390 |
| 2020 | $1,170 | $181,391 | $43,000 | $138,391 |
| 2019 | $1,223 | $181,391 | $43,000 | $138,391 |
| 2018 | $1,206 | $163,340 | $43,000 | $120,340 |
| 2017 | $1,125 | $80,520 | $0 | $0 |
| 2016 | $1,166 | $80,520 | $0 | $0 |
| 2015 | $1,081 | $74,585 | $0 | $0 |
| 2014 | $977 | $74,585 | $0 | $0 |
| 2013 | -- | $74,585 | $0 | $0 |
Source: Public Records
Map
Nearby Homes
- 1206 S 900 W
- 591 Southwest St
- 1214 W 575 S
- 553 Center Ave
- 1204 W 575 S
- 1210 W 575 S Unit 163
- 1210 W 575 S
- 551 S 1215 W Unit 131
- 539 S 1215 W Unit 129
- 508 S 1215 W Unit 144
- 1239 W 575 S
- 420 S 1400 W
- 1099 Three Pointe Ave
- 562 S 1215 W Unit 135
- 370 S 1200 W Unit 2
- 1031 W 350 S
- 952 W 330 S
- 1400 S 940 W
- 1506 Silver Canoe Loop
- 207 Sunstone Cir
Your Personal Tour Guide
Ask me questions while you tour the home.