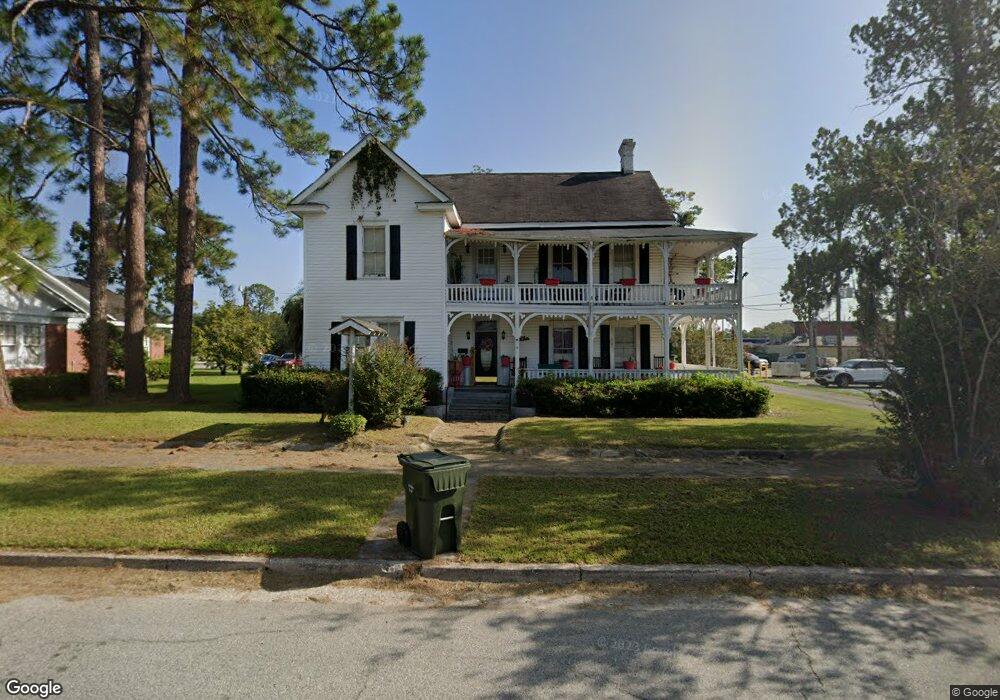
110 Thomas St Waycross, GA 31501
Estimated Value: $141,000 - $178,000
7
Beds
3
Baths
3,876
Sq Ft
$41/Sq Ft
Est. Value
About This Home
This home is located at 110 Thomas St, Waycross, GA 31501 and is currently estimated at $159,542, approximately $41 per square foot. 110 Thomas St is a home located in Ware County with nearby schools including Williams Heights Elementary School, Waycross Middle School, and Ware County High School.
Ownership History
Date
Name
Owned For
Owner Type
Purchase Details
Closed on
Mar 30, 2015
Sold by
Cart Ben M
Bought by
Pierce Kathy
Current Estimated Value
Home Financials for this Owner
Home Financials are based on the most recent Mortgage that was taken out on this home.
Original Mortgage
$50,238
Interest Rate
3.89%
Mortgage Type
Commercial
Purchase Details
Closed on
Jul 3, 2013
Sold by
Farmers & Merchants Bank
Bought by
Cart Ben M
Purchase Details
Closed on
Mar 1, 2011
Sold by
Nwosu Oguchi
Bought by
Farmers & Merchants Bank
Purchase Details
Closed on
Jan 27, 2009
Sold by
Brumbeloe Ken P
Bought by
L J Home Repair Llc
Purchase Details
Closed on
Jun 27, 2002
Sold by
Johnston John D and Johnston Be
Bought by
Nwosu Oguchi
Purchase Details
Closed on
Nov 1, 1988
Bought by
Johnston John D and Johnston Be
Purchase Details
Closed on
Jun 1, 1988
Purchase Details
Closed on
Nov 3, 1987
Create a Home Valuation Report for This Property
The Home Valuation Report is an in-depth analysis detailing your home's value as well as a comparison with similar homes in the area
Home Values in the Area
Average Home Value in this Area
Purchase History
| Date | Buyer | Sale Price | Title Company |
|---|---|---|---|
| Pierce Kathy | $55,000 | -- | |
| Cart Ben M | $45,200 | -- | |
| Farmers & Merchants Bank | $100,000 | -- | |
| L J Home Repair Llc | $98,500 | -- | |
| Nwosu Oguchi | $44,300 | -- | |
| Johnston John D | -- | -- | |
| -- | -- | -- | |
| -- | -- | -- |
Source: Public Records
Mortgage History
| Date | Status | Borrower | Loan Amount |
|---|---|---|---|
| Closed | Pierce Kathy | $50,238 |
Source: Public Records
Tax History Compared to Growth
Tax History
| Year | Tax Paid | Tax Assessment Tax Assessment Total Assessment is a certain percentage of the fair market value that is determined by local assessors to be the total taxable value of land and additions on the property. | Land | Improvement |
|---|---|---|---|---|
| 2024 | -- | $53,215 | $1,440 | $51,775 |
| 2023 | $0 | $60,289 | $8,363 | $51,926 |
| 2022 | $2,403 | $60,289 | $8,363 | $51,926 |
| 2021 | $2,038 | $47,153 | $8,363 | $38,790 |
| 2020 | $2,029 | $46,549 | $8,363 | $38,186 |
| 2019 | $2,042 | $46,201 | $8,363 | $37,838 |
| 2018 | $0 | $44,465 | $8,363 | $36,102 |
| 2017 | $959 | $31,966 | $8,363 | $23,603 |
| 2016 | $959 | $31,966 | $8,363 | $23,603 |
| 2015 | $1,404 | $31,966 | $8,363 | $23,603 |
| 2014 | $793 | $31,966 | $8,363 | $23,603 |
| 2013 | -- | $45,304 | $8,363 | $36,940 |
Source: Public Records
Map
Nearby Homes
- 310 Butler St
- 415 Dewey St
- 301 Riverside Dr
- 502 Dewey St
- 1405 Grove Ave
- 511 Riverside Dr
- 807 College St
- 418 Reed St
- 1504 Habersham Dr
- 306 Lee Ave
- 629 Remshart St
- 506 Magnolia Dr
- 516 Folks St
- 812 Effie St
- 924 Highsmith St
- .22 Alice St
- 511 Richmond Ave
- 1101 Cherokee Dr
- 506 McDonald St
- 808 Satilla Blvd