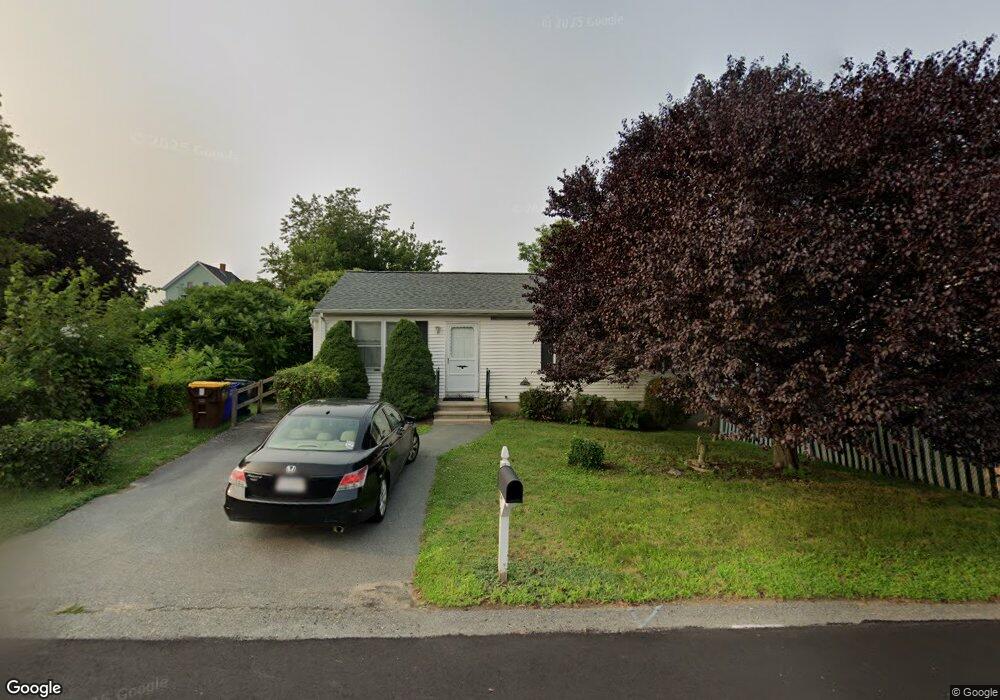
110 Tucker St Fall River, MA 02724
Father Kelly NeighborhoodEstimated Value: $412,032 - $485,000
3
Beds
2
Baths
1,512
Sq Ft
$288/Sq Ft
Est. Value
About This Home
This home is located at 110 Tucker St, Fall River, MA 02724 and is currently estimated at $435,258, approximately $287 per square foot. 110 Tucker St is a home located in Bristol County with nearby schools including Henry Lord Community School, B M C Durfee High School, and Argosy Collegiate Charter School.
Ownership History
Date
Name
Owned For
Owner Type
Purchase Details
Closed on
Oct 14, 1999
Sold by
Patenaude Joyce A
Bought by
Arsenault Lucien
Current Estimated Value
Home Financials for this Owner
Home Financials are based on the most recent Mortgage that was taken out on this home.
Original Mortgage
$101,800
Outstanding Balance
$30,134
Interest Rate
7.8%
Mortgage Type
Purchase Money Mortgage
Estimated Equity
$405,124
Create a Home Valuation Report for This Property
The Home Valuation Report is an in-depth analysis detailing your home's value as well as a comparison with similar homes in the area
Home Values in the Area
Average Home Value in this Area
Purchase History
| Date | Buyer | Sale Price | Title Company |
|---|---|---|---|
| Arsenault Lucien | $113,200 | -- |
Source: Public Records
Mortgage History
| Date | Status | Borrower | Loan Amount |
|---|---|---|---|
| Open | Arsenault Lucien | $10,000 | |
| Open | Arsenault Lucien | $101,800 |
Source: Public Records
Tax History
| Year | Tax Paid | Tax Assessment Tax Assessment Total Assessment is a certain percentage of the fair market value that is determined by local assessors to be the total taxable value of land and additions on the property. | Land | Improvement |
|---|---|---|---|---|
| 2025 | $4,101 | $358,200 | $126,200 | $232,000 |
| 2024 | $3,824 | $332,800 | $121,400 | $211,400 |
| 2023 | $3,760 | $306,400 | $104,100 | $202,300 |
| 2022 | $3,250 | $257,500 | $94,600 | $162,900 |
| 2021 | $4,357 | $222,200 | $87,600 | $134,600 |
| 2020 | $4,280 | $204,000 | $83,800 | $120,200 |
| 2019 | $2,786 | $191,100 | $79,800 | $111,300 |
| 2018 | $4,347 | $183,700 | $78,300 | $105,400 |
| 2017 | $2,566 | $183,300 | $79,900 | $103,400 |
| 2016 | $2,468 | $181,100 | $83,200 | $97,900 |
| 2015 | $2,364 | $180,700 | $80,200 | $100,500 |
| 2014 | $2,326 | $184,900 | $84,400 | $100,500 |
Source: Public Records
Map
Nearby Homes
Your Personal Tour Guide
Ask me questions while you tour the home.