Estimated Value: $227,000 - $269,000
3
Beds
2
Baths
1,728
Sq Ft
$140/Sq Ft
Est. Value
About This Home
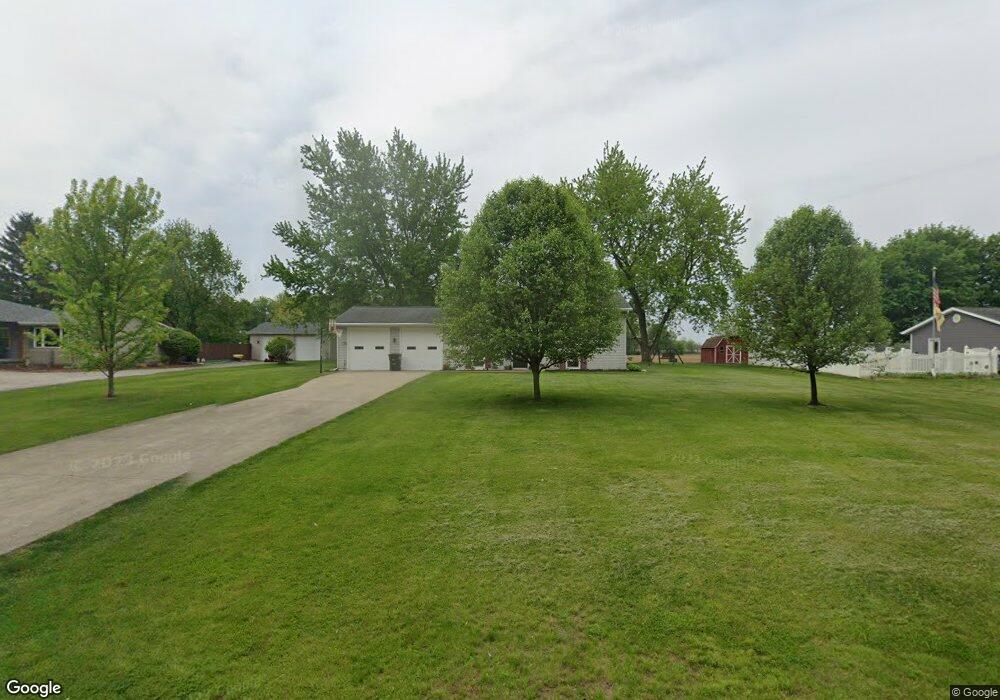
This home is located at 110 W 400 N, Howe, IN 46746 and is currently estimated at $241,202, approximately $139 per square foot. 110 W 400 N is a home located in LaGrange County with nearby schools including Lakeland Jr/Sr High School, Southeast Clay School, and Creekside Amish School.
Ownership History
Date
Name
Owned For
Owner Type
Purchase Details
Closed on
Jul 31, 2024
Sold by
Jahnke Nichole M
Bought by
Oakley Misti and Green Rilee
Current Estimated Value
Home Financials for this Owner
Home Financials are based on the most recent Mortgage that was taken out on this home.
Original Mortgage
$203,700
Outstanding Balance
$201,395
Interest Rate
6.87%
Mortgage Type
New Conventional
Estimated Equity
$39,807
Purchase Details
Closed on
Jan 22, 2016
Sold by
Sharon L Weldon
Bought by
Nichole M Jahnke
Create a Home Valuation Report for This Property
The Home Valuation Report is an in-depth analysis detailing your home's value as well as a comparison with similar homes in the area
Home Values in the Area
Average Home Value in this Area
Purchase History
| Date | Buyer | Sale Price | Title Company |
|---|---|---|---|
| Oakley Misti | $210,000 | None Listed On Document | |
| Nichole M Jahnke | $131,000 | Lakeland Title Company |
Source: Public Records
Mortgage History
| Date | Status | Borrower | Loan Amount |
|---|---|---|---|
| Open | Oakley Misti | $203,700 |
Source: Public Records
Tax History Compared to Growth
Tax History
| Year | Tax Paid | Tax Assessment Tax Assessment Total Assessment is a certain percentage of the fair market value that is determined by local assessors to be the total taxable value of land and additions on the property. | Land | Improvement |
|---|---|---|---|---|
| 2024 | $383 | $135,300 | $17,300 | $118,000 |
| 2023 | $300 | $120,600 | $14,400 | $106,200 |
| 2022 | $342 | $117,800 | $14,000 | $103,800 |
| 2021 | $283 | $106,700 | $14,000 | $92,700 |
| 2020 | $291 | $104,300 | $14,000 | $90,300 |
| 2019 | $243 | $94,500 | $14,000 | $80,500 |
| 2018 | $295 | $99,800 | $14,000 | $85,800 |
| 2017 | $252 | $92,000 | $12,700 | $79,300 |
| 2016 | $238 | $89,700 | $12,700 | $77,000 |
| 2014 | $260 | $89,000 | $12,700 | $76,300 |
| 2013 | $260 | $89,800 | $12,700 | $77,100 |
Source: Public Records
Map
Nearby Homes
- 125 E Lot 10
- 2930 N 080 E
- 403 Williams St
- 1510 Indiana 120
- 3915 N 200 E
- 0 N 100 W
- 4370 N 230 E
- 1770 W 570 N
- 1375 W 610 N
- 1895 W 570 N
- 1575 W 195 N
- 5145 N 290 W
- 510 E 700 N
- 915 N 015 E
- 1400 N 200 E
- 737 N Canal St
- 0 Corner of Factory St & Townline Rd Unit 202541800
- 217 N Sherman St
- 306 N 100 E
- 914 S Detroit St