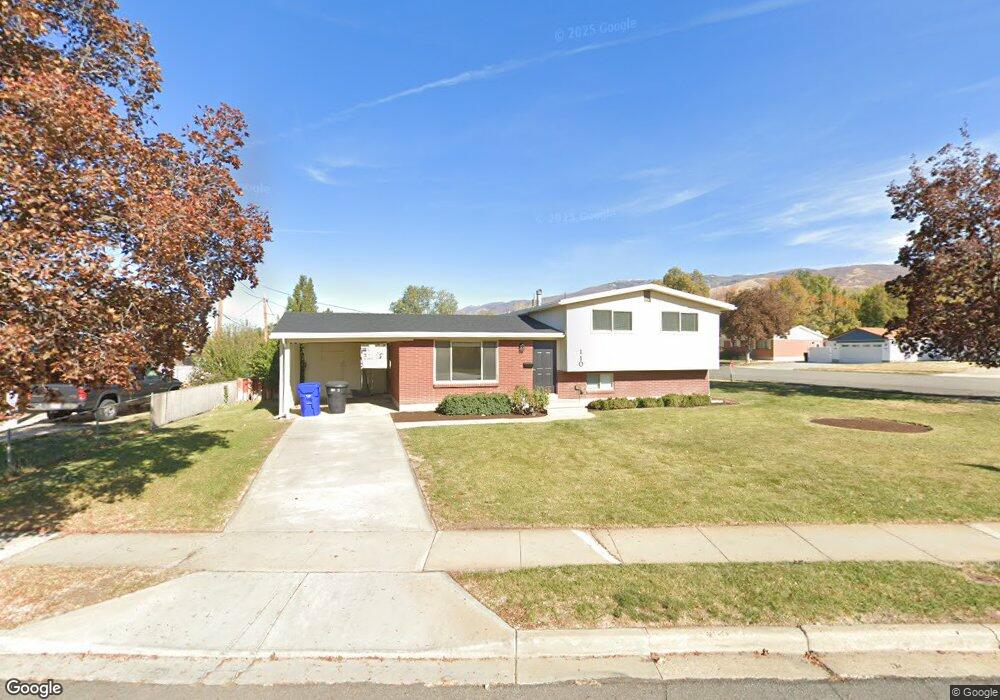
110 W 900 S Bountiful, UT 84010
Estimated Value: $442,000 - $461,000
3
Beds
2
Baths
1,612
Sq Ft
$281/Sq Ft
Est. Value
About This Home
This home is located at 110 W 900 S, Bountiful, UT 84010 and is currently estimated at $452,778, approximately $280 per square foot. 110 W 900 S is a home located in Davis County with nearby schools including Bountiful Elementary School, Millcreek Junior High School, and Bountiful High School.
Ownership History
Date
Name
Owned For
Owner Type
Purchase Details
Closed on
Jan 15, 2025
Sold by
Ginter Steven and Ginter Sylvia
Bought by
Ginter Family Trust and Ginter
Current Estimated Value
Purchase Details
Closed on
Sep 29, 2022
Sold by
Ginter Steven
Bought by
Ginter Steven and Ginter Sylvia
Home Financials for this Owner
Home Financials are based on the most recent Mortgage that was taken out on this home.
Original Mortgage
$250,000
Interest Rate
5.13%
Mortgage Type
New Conventional
Purchase Details
Closed on
Sep 27, 2022
Sold by
Rex And Ina Christensen Family Trust
Bought by
Ginter Steven
Home Financials for this Owner
Home Financials are based on the most recent Mortgage that was taken out on this home.
Original Mortgage
$250,000
Interest Rate
5.13%
Mortgage Type
New Conventional
Purchase Details
Closed on
Sep 7, 2000
Sold by
Christensen Rex Leroy and Christensen Marie
Bought by
Christensen Marie
Create a Home Valuation Report for This Property
The Home Valuation Report is an in-depth analysis detailing your home's value as well as a comparison with similar homes in the area
Purchase History
| Date | Buyer | Sale Price | Title Company |
|---|---|---|---|
| Ginter Family Trust | -- | None Listed On Document | |
| Ginter Family Trust | -- | None Listed On Document | |
| Ginter Steven | -- | -- | |
| Ginter Steven | -- | Aspen Title | |
| Christensen Marie | -- | -- |
Source: Public Records
Mortgage History
| Date | Status | Borrower | Loan Amount |
|---|---|---|---|
| Previous Owner | Ginter Steven | $250,000 |
Source: Public Records
Tax History
| Year | Tax Paid | Tax Assessment Tax Assessment Total Assessment is a certain percentage of the fair market value that is determined by local assessors to be the total taxable value of land and additions on the property. | Land | Improvement |
|---|---|---|---|---|
| 2025 | $2,490 | $222,750 | $122,394 | $100,356 |
| 2024 | $2,319 | $216,150 | $108,400 | $107,750 |
| 2023 | $2,212 | $374,000 | $200,363 | $173,637 |
| 2022 | $2,324 | $216,150 | $109,660 | $106,490 |
| 2021 | $2,013 | $285,000 | $143,475 | $141,525 |
| 2020 | $1,753 | $248,000 | $122,795 | $125,205 |
| 2019 | $1,824 | $253,000 | $131,293 | $121,707 |
| 2018 | $1,683 | $229,000 | $128,735 | $100,265 |
| 2016 | $1,399 | $102,630 | $52,930 | $49,700 |
| 2015 | $1,357 | $93,885 | $52,930 | $40,955 |
| 2014 | $1,306 | $92,960 | $52,930 | $40,030 |
| 2013 | -- | $88,955 | $34,381 | $54,574 |
Source: Public Records
Map
Nearby Homes
Your Personal Tour Guide
Ask me questions while you tour the home.