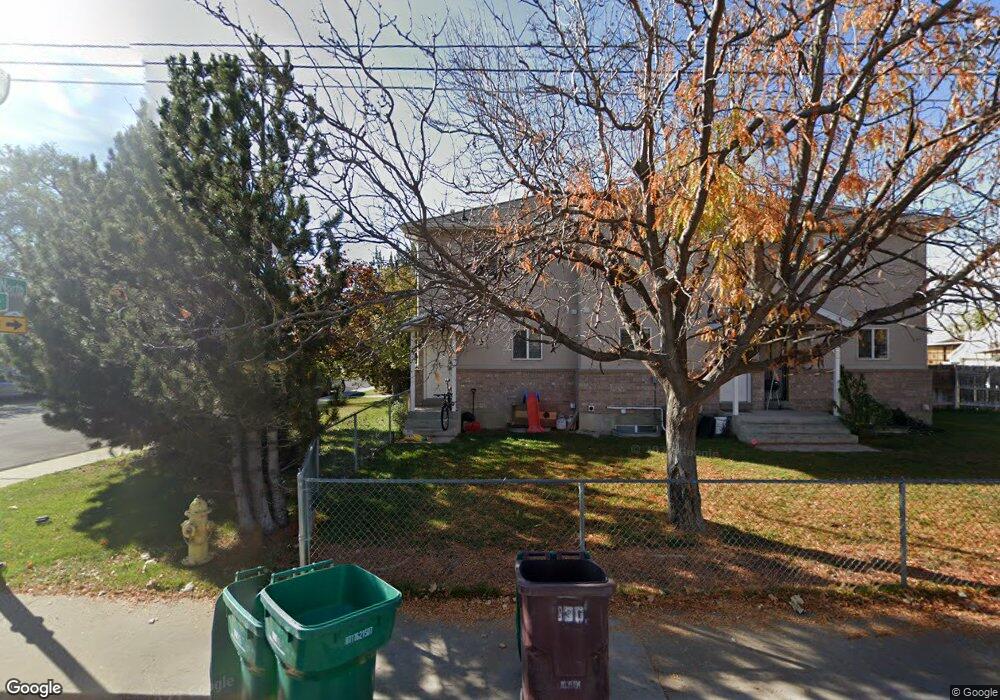
110 W 930 N Unit 6 Orem, UT 84057
Windsor NeighborhoodEstimated Value: $341,016 - $371,000
3
Beds
2
Baths
1,440
Sq Ft
$250/Sq Ft
Est. Value
About This Home
This home is located at 110 W 930 N Unit 6, Orem, UT 84057 and is currently estimated at $360,005, approximately $250 per square foot. 110 W 930 N Unit 6 is a home located in Utah County with nearby schools including Windsor School, Canyon View Junior High School, and Timpanogos High School.
Ownership History
Date
Name
Owned For
Owner Type
Purchase Details
Closed on
Oct 10, 2008
Sold by
Webster Martin Joseph
Bought by
Snow S R
Current Estimated Value
Purchase Details
Closed on
Feb 8, 1999
Sold by
Seow Anthony Sooyiam and Seow Meriam Muihwa
Bought by
Webster Martin Joseph
Home Financials for this Owner
Home Financials are based on the most recent Mortgage that was taken out on this home.
Original Mortgage
$8,588
Interest Rate
6.73%
Mortgage Type
Seller Take Back
Create a Home Valuation Report for This Property
The Home Valuation Report is an in-depth analysis detailing your home's value as well as a comparison with similar homes in the area
Home Values in the Area
Average Home Value in this Area
Purchase History
| Date | Buyer | Sale Price | Title Company |
|---|---|---|---|
| Snow S R | $119,822 | None Available | |
| Webster Martin Joseph | -- | Old Republic Title Company |
Source: Public Records
Mortgage History
| Date | Status | Borrower | Loan Amount |
|---|---|---|---|
| Previous Owner | Webster Martin Joseph | $8,588 |
Source: Public Records
Tax History
| Year | Tax Paid | Tax Assessment Tax Assessment Total Assessment is a certain percentage of the fair market value that is determined by local assessors to be the total taxable value of land and additions on the property. | Land | Improvement |
|---|---|---|---|---|
| 2025 | $1,449 | $183,480 | -- | -- |
| 2024 | $1,449 | $177,210 | $0 | $0 |
| 2023 | $1,317 | $173,085 | $0 | $0 |
| 2022 | $1,391 | $177,155 | $0 | $0 |
| 2021 | $1,256 | $242,200 | $36,300 | $205,900 |
| 2020 | $1,143 | $216,700 | $32,500 | $184,200 |
| 2019 | $776 | $153,000 | $27,200 | $125,800 |
| 2018 | $812 | $153,000 | $27,200 | $125,800 |
| 2017 | $834 | $84,150 | $0 | $0 |
| 2016 | $905 | $84,150 | $0 | $0 |
| 2015 | $957 | $84,150 | $0 | $0 |
| 2014 | $854 | $74,800 | $0 | $0 |
Source: Public Records
Map
Nearby Homes
- 125 W 870 N
- 16 E 925 N
- 917 N Garden Dr
- 1111 N 150 W
- 789 200 E Unit 787
- 597 N State St Unit 25
- 620 N 120 E
- 512 N 100 E
- 362 E 800 N Unit 1
- 538 W 1120 N
- 287 W 1380 N
- 372 E 1165 N
- 33 W 400 N
- 369 N Main St Unit 2
- 332 W Amiron Way Unit D
- 1371 N 330 E Unit 8
- 1244 N 580 W
- 337 Birchwood Dr
- 471 E 700 N
- 305 E Elmwood Dr
Your Personal Tour Guide
Ask me questions while you tour the home.