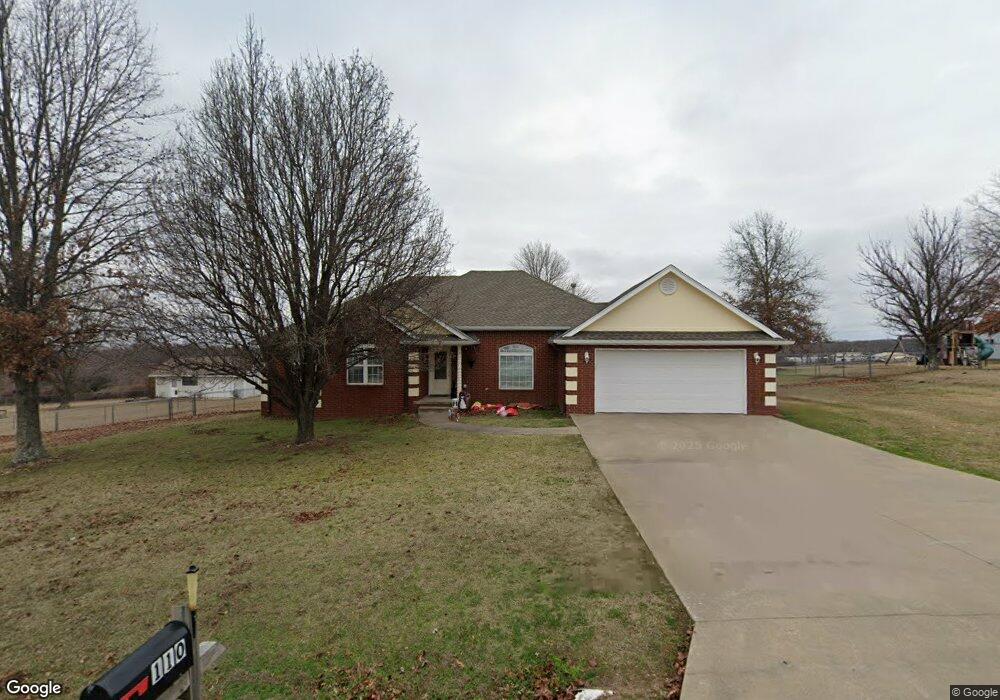
110 W Calista Dr Tahlequah, OK 74464
Estimated Value: $233,000 - $264,000
3
Beds
2
Baths
1,761
Sq Ft
$142/Sq Ft
Est. Value
About This Home
This home is located at 110 W Calista Dr, Tahlequah, OK 74464 and is currently estimated at $249,196, approximately $141 per square foot. 110 W Calista Dr is a home located in Cherokee County with nearby schools including Grand View Public School.
Ownership History
Date
Name
Owned For
Owner Type
Purchase Details
Closed on
Feb 8, 2022
Sold by
Giles Gregory C and Giles Jane L
Bought by
Giles Family Trust
Current Estimated Value
Purchase Details
Closed on
Dec 5, 2011
Sold by
Giles Jane L and Giles Gregory C
Bought by
Giles Gregory C and Giles Jane L
Home Financials for this Owner
Home Financials are based on the most recent Mortgage that was taken out on this home.
Original Mortgage
$69,000
Interest Rate
4.14%
Mortgage Type
New Conventional
Purchase Details
Closed on
Jun 19, 2008
Sold by
Giles Gregory C and Giles Jane L
Bought by
Giles Jane L
Home Financials for this Owner
Home Financials are based on the most recent Mortgage that was taken out on this home.
Original Mortgage
$72,500
Interest Rate
6.05%
Mortgage Type
New Conventional
Purchase Details
Closed on
Jul 23, 1999
Sold by
Brad and Beatrice Tullis
Bought by
Gregory and Jane Giles
Purchase Details
Closed on
Jan 20, 1999
Sold by
Steven and Tanya Wilson
Bought by
Brad and Beatrice Tullis
Create a Home Valuation Report for This Property
The Home Valuation Report is an in-depth analysis detailing your home's value as well as a comparison with similar homes in the area
Home Values in the Area
Average Home Value in this Area
Purchase History
| Date | Buyer | Sale Price | Title Company |
|---|---|---|---|
| Giles Family Trust | -- | None Listed On Document | |
| Giles Gregory C | -- | Tahlequah Abstract & Closing | |
| Giles Jane L | -- | Tahlequah Abstract Closing S | |
| Gregory | $109,000 | -- | |
| Brad | $9,500 | -- |
Source: Public Records
Mortgage History
| Date | Status | Borrower | Loan Amount |
|---|---|---|---|
| Previous Owner | Giles Gregory C | $69,000 | |
| Previous Owner | Giles Jane L | $72,500 |
Source: Public Records
Tax History Compared to Growth
Tax History
| Year | Tax Paid | Tax Assessment Tax Assessment Total Assessment is a certain percentage of the fair market value that is determined by local assessors to be the total taxable value of land and additions on the property. | Land | Improvement |
|---|---|---|---|---|
| 2025 | $1,385 | $18,210 | $1,238 | $16,972 |
| 2024 | $1,385 | $17,680 | $1,202 | $16,478 |
| 2023 | $1,385 | $17,165 | $982 | $16,183 |
| 2022 | $1,112 | $16,665 | $953 | $15,712 |
| 2021 | $1,077 | $16,179 | $925 | $15,254 |
| 2020 | $1,044 | $15,708 | $898 | $14,810 |
| 2019 | $1,105 | $15,251 | $872 | $14,379 |
| 2018 | $1,078 | $14,807 | $829 | $13,978 |
| 2017 | $1,050 | $14,376 | $805 | $13,571 |
| 2016 | $1,024 | $13,957 | $781 | $13,176 |
| 2015 | $958 | $13,551 | $866 | $12,685 |
| 2014 | $958 | $13,156 | $1,045 | $12,111 |
Source: Public Records
Map
Nearby Homes
- 212 W Calista Dr
- 17564 W Grandview Dr
- 17540 W Tray
- 13552 State Highway 82
- 17099 E Clover Cir
- 0 W Jones Rd
- 149 W Oak Hill Cir
- 20819 E Steely Hollow Rd
- TBD Blk 1 Lot 11 E Steely Hollow Rd
- TBD Blk 1 Lot 4 E Steely Hollow Rd
- TBD BLK 1 Lot 10 E Steely Hollow Rd
- TBD BLK 1 Lot 9 E Steely Hollow Rd
- TBD Blk 1 Lot 1 E Steely Hollow Rd
- TBD BLK 1 Lot 2 E Steely Hollow Rd
- TBD Blk 1 Lot 6 E Steely Hollow Rd
- TBD Blk 1 Lot 8 E Steely Hollow Rd
- TBD Blk 1 Lot 5 E Steely Hollow Rd
- 100 Career Tech
- 540 N Moccasin
- 501 Airport
- 108 W Calista Dr
- 112 W Calista Dr
- 111 W Calista Dr
- 113 W Calista Dr
- 114 W Calista Dr
- 106 W Calista Dr
- 109 W Calista Dr
- 115 W Calista Dr
- 107 W Calista Dr
- 104 W Calista Dr
- 201 W Calista Dr
- 105 W Calista Dr
- 202 W Calista Dr
- 106 W Clay Rd
- 110 W Clay Rd
- 102 W Calista Dr
- 203 W Calista Dr
- 104 W Clay Rd
- 204 W Calista Dr
- 103 W Calista Dr