110 W Main St Unit 25 Hyannis, MA 02601
Estimated Value: $296,000 - $479,000
1
Bed
1
Bath
650
Sq Ft
$534/Sq Ft
Est. Value
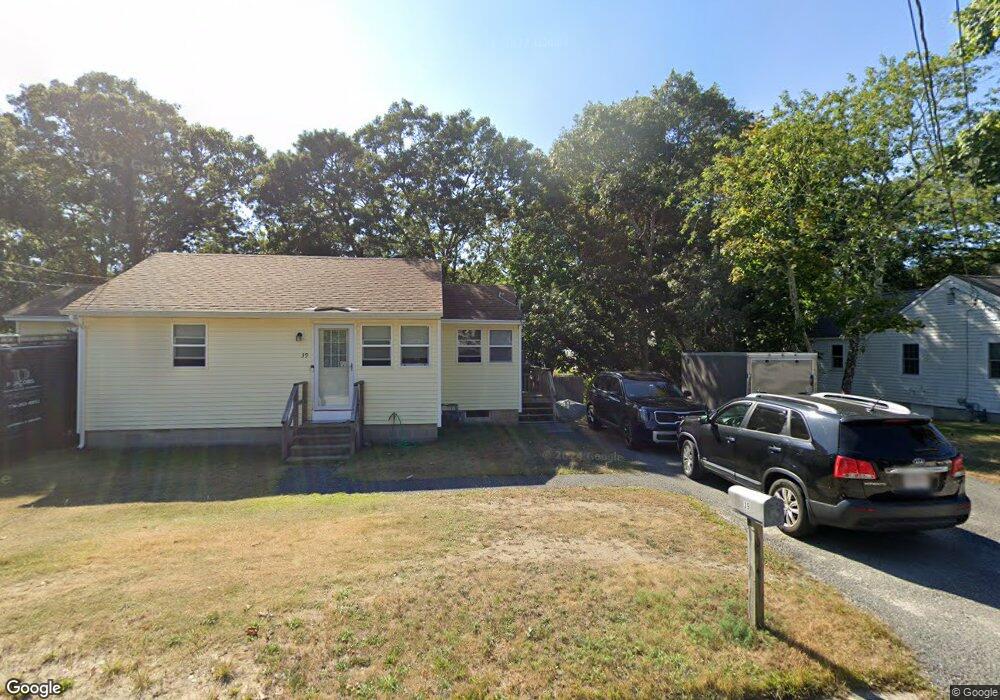
About This Home
This home is located at 110 W Main St Unit 25, Hyannis, MA 02601 and is currently estimated at $347,221, approximately $534 per square foot. 110 W Main St Unit 25 is a home located in Barnstable County with nearby schools including Hyannis West Elementary School, Barnstable United Elementary School, and Barnstable Intermediate School.
Ownership History
Date
Name
Owned For
Owner Type
Purchase Details
Closed on
Jul 30, 2025
Sold by
Walker Douglas E
Bought by
Douglas Edwin Walker Ret and Walker
Current Estimated Value
Purchase Details
Closed on
Feb 16, 2005
Sold by
Harold Walker Rt and Walker
Bought by
Walker Douglas E
Purchase Details
Closed on
May 28, 2004
Sold by
Walker Harold
Bought by
Harold Walker Rt and Walker
Purchase Details
Closed on
Feb 2, 2004
Sold by
Taylor Martha M
Bought by
Walker Harold
Home Financials for this Owner
Home Financials are based on the most recent Mortgage that was taken out on this home.
Original Mortgage
$100,000
Interest Rate
5.82%
Mortgage Type
Purchase Money Mortgage
Purchase Details
Closed on
Oct 31, 2003
Sold by
Gallagher Lawrence D
Bought by
Taylor Martha M
Purchase Details
Closed on
Oct 31, 2001
Sold by
Leppanen Frances and Leppanen Eric W
Bought by
Gallagher Lawrence D
Create a Home Valuation Report for This Property
The Home Valuation Report is an in-depth analysis detailing your home's value as well as a comparison with similar homes in the area
Home Values in the Area
Average Home Value in this Area
Purchase History
| Date | Buyer | Sale Price | Title Company |
|---|---|---|---|
| Douglas Edwin Walker Ret | -- | -- | |
| Douglas Edwin Walker Ret | -- | -- | |
| Walker Douglas E | -- | -- | |
| Walker Douglas E | -- | -- | |
| Harold Walker Rt | -- | -- | |
| Harold Walker Rt | -- | -- | |
| Walker Harold | $142,000 | -- | |
| Walker Harold | $142,000 | -- | |
| Taylor Martha M | $142,500 | -- | |
| Taylor Martha M | $142,500 | -- | |
| Gallagher Lawrence D | $88,000 | -- | |
| Gallagher Lawrence D | $88,000 | -- |
Source: Public Records
Mortgage History
| Date | Status | Borrower | Loan Amount |
|---|---|---|---|
| Previous Owner | Gallagher Lawrence D | $75,000 | |
| Previous Owner | Gallagher Lawrence D | $100,000 |
Source: Public Records
Tax History Compared to Growth
Tax History
| Year | Tax Paid | Tax Assessment Tax Assessment Total Assessment is a certain percentage of the fair market value that is determined by local assessors to be the total taxable value of land and additions on the property. | Land | Improvement |
|---|---|---|---|---|
| 2025 | $2,400 | $258,900 | $0 | $258,900 |
| 2024 | $2,354 | $260,100 | $0 | $260,100 |
| 2023 | $1,669 | $174,400 | $0 | $174,400 |
| 2022 | $1,733 | $149,800 | $0 | $149,800 |
| 2021 | $1,728 | $145,100 | $0 | $145,100 |
| 2020 | $1,231 | $99,800 | $0 | $99,800 |
| 2019 | $1,224 | $97,300 | $0 | $97,300 |
| 2018 | $1,156 | $94,000 | $0 | $94,000 |
| 2017 | $1,138 | $94,900 | $0 | $94,900 |
| 2016 | $1,113 | $94,900 | $0 | $94,900 |
| 2015 | $1,062 | $91,800 | $0 | $91,800 |
Source: Public Records
Map
Nearby Homes
- 24 Bettys Pond Rd Unit K
- 24 Betty's Pond Rd Unit 1K
- 135 W Main St Unit 45
- 15 Goldie Way
- 292 Megan Rd
- 297 W Main St Unit 12
- 220 Fawcett Ln
- 93 Sea St
- 57 Suffolk Ave
- 295 Sudbury Ln
- 7 Arbeta Rd
- 50 Redwood Ln
- 142 Chestnut St
- 229 Greenwood Ave
- 36 Grouse Ln
- 14 Marston Ave
- 83 Peacock Dr
- 20 Sunset Terrace
- 417 Scudder Ave
- 427 Scudder Ave
- 110 W Main St Unit 29
- 110 W Main St Unit 28
- 110 W Main St Unit 27
- 110 W Main St Unit 26
- 110 W Main St Unit 24
- 110 W Main St Unit 23
- 110 W Main St Unit 22
- 110 W Main St Unit 20
- 110 W Main St Unit 19
- 110 W Main St Unit 18
- 110 W Main St Unit 17
- 110 W Main St Unit 16
- 110 W Main St Unit 15
- 110 W Main St Unit 14
- 110 W Main St Unit 13
- 110 W Main St Unit 11
- 110 W Main St Unit 10
- 110 W Main St Unit 9
- 110 W Main St Unit 8
- 110 W Main St Unit 7