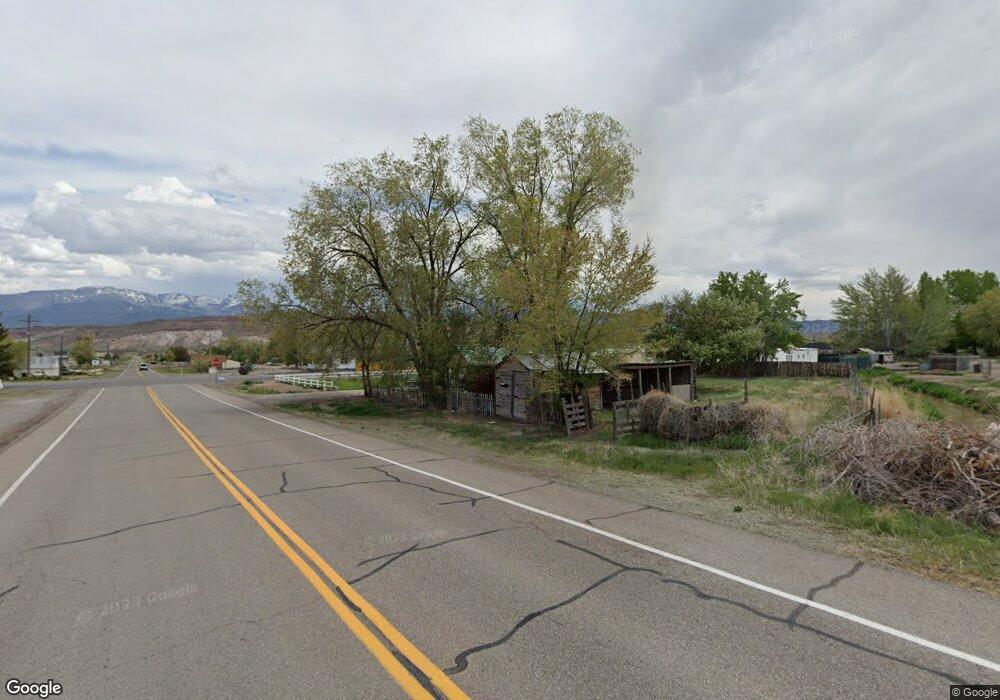
110 W Main St Joseph, UT 84739
Estimated Value: $324,000 - $800,000
Studio
--
Bath
2,293
Sq Ft
$199/Sq Ft
Est. Value
About This Home
This home is located at 110 W Main St, Joseph, UT 84739 and is currently estimated at $456,627, approximately $199 per square foot. 110 W Main St is a home with nearby schools including Monroe School, South Sevier Middle School, and South Sevier High School.
Ownership History
Date
Name
Owned For
Owner Type
Purchase Details
Closed on
Oct 19, 2020
Sold by
Shaw Harold
Bought by
Manning Stewart L
Current Estimated Value
Home Financials for this Owner
Home Financials are based on the most recent Mortgage that was taken out on this home.
Original Mortgage
$143,846
Outstanding Balance
$126,829
Interest Rate
2.8%
Mortgage Type
FHA
Estimated Equity
$329,798
Purchase Details
Closed on
Aug 1, 2012
Sold by
Williams James
Bought by
Shaw Harold
Home Financials for this Owner
Home Financials are based on the most recent Mortgage that was taken out on this home.
Original Mortgage
$90,000
Interest Rate
3.56%
Mortgage Type
New Conventional
Purchase Details
Closed on
Mar 9, 2005
Sold by
Higgins Gene and Higgins Rosalee
Bought by
Williams James
Home Financials for this Owner
Home Financials are based on the most recent Mortgage that was taken out on this home.
Original Mortgage
$91,200
Interest Rate
5.61%
Mortgage Type
New Conventional
Create a Home Valuation Report for This Property
The Home Valuation Report is an in-depth analysis detailing your home's value as well as a comparison with similar homes in the area
Purchase History
| Date | Buyer | Sale Price | Title Company |
|---|---|---|---|
| Manning Stewart L | -- | First American Ttl Richfield | |
| Shaw Harold | -- | Utah Title & Abstract | |
| Williams James | -- | First American Title Ins Age |
Source: Public Records
Mortgage History
| Date | Status | Borrower | Loan Amount |
|---|---|---|---|
| Open | Manning Stewart L | $143,846 | |
| Previous Owner | Shaw Harold | $90,000 | |
| Previous Owner | Williams James | $91,200 |
Source: Public Records
Tax History
| Year | Tax Paid | Tax Assessment Tax Assessment Total Assessment is a certain percentage of the fair market value that is determined by local assessors to be the total taxable value of land and additions on the property. | Land | Improvement |
|---|---|---|---|---|
| 2025 | $2,365 | $273,910 | $72,674 | $201,236 |
| 2024 | $2,365 | $290,938 | $61,910 | $229,028 |
| 2023 | $2,564 | $267,685 | $58,767 | $208,918 |
| 2022 | $2,923 | $288,534 | $54,029 | $234,505 |
| 2021 | $2,240 | $182,831 | $30,736 | $152,095 |
| 2020 | $2,057 | $157,216 | $19,210 | $138,006 |
| 2019 | $1,008 | $82,090 | $11,220 | $70,870 |
| 2018 | $1,026 | $74,340 | $11,220 | $63,120 |
| 2017 | $1,016 | $70,460 | $11,220 | $59,240 |
| 2016 | $780 | $68,480 | $0 | $0 |
| 2015 | $780 | $68,480 | $0 | $0 |
| 2014 | $780 | $68,480 | $0 | $0 |
Source: Public Records
Map
Nearby Homes
Your Personal Tour Guide
Ask me questions while you tour the home.