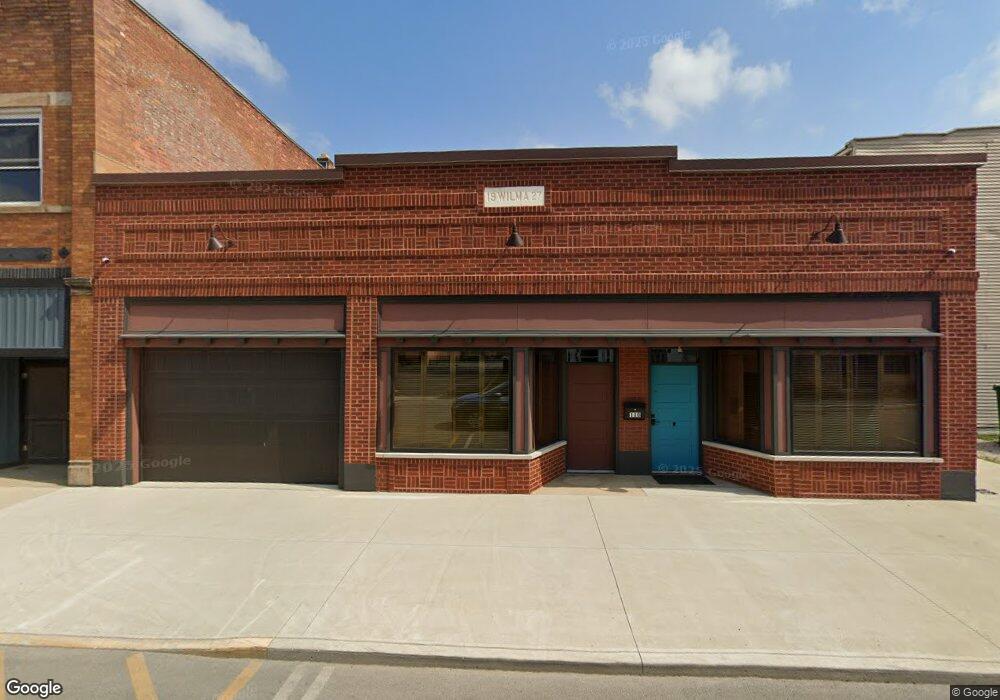
110 W North St Fostoria, OH 44830
Estimated Value: $135,000 - $164,000
2
Beds
2
Baths
2,688
Sq Ft
$57/Sq Ft
Est. Value
About This Home
This home is located at 110 W North St, Fostoria, OH 44830 and is currently estimated at $153,153, approximately $56 per square foot. 110 W North St is a home located in Seneca County with nearby schools including Fostoria Intermediate Elementary School and Fostoria Junior/Senior High School.
Ownership History
Date
Name
Owned For
Owner Type
Purchase Details
Closed on
Jun 25, 2018
Sold by
Rywalski Htta Danielle M and Nagel Danielle M
Bought by
Mennel Donald L
Current Estimated Value
Purchase Details
Closed on
Mar 23, 2000
Sold by
Evans Paul R
Bought by
Nagel Danielle M
Purchase Details
Closed on
Jun 3, 1991
Sold by
Evans Paul R
Bought by
Evans Paul R
Purchase Details
Closed on
Mar 1, 1986
Create a Home Valuation Report for This Property
The Home Valuation Report is an in-depth analysis detailing your home's value as well as a comparison with similar homes in the area
Home Values in the Area
Average Home Value in this Area
Purchase History
| Date | Buyer | Sale Price | Title Company |
|---|---|---|---|
| Mennel Donald L | $30,000 | Midland Title | |
| Nagel Danielle M | $48,000 | -- | |
| Evans Paul R | -- | -- | |
| -- | $48,000 | -- |
Source: Public Records
Tax History Compared to Growth
Tax History
| Year | Tax Paid | Tax Assessment Tax Assessment Total Assessment is a certain percentage of the fair market value that is determined by local assessors to be the total taxable value of land and additions on the property. | Land | Improvement |
|---|---|---|---|---|
| 2024 | $2,359 | $45,840 | $3,920 | $41,920 |
| 2023 | $2,364 | $45,840 | $3,920 | $41,920 |
| 2022 | $1,572 | $27,170 | $3,190 | $23,980 |
| 2021 | $1,606 | $27,170 | $3,190 | $23,980 |
| 2020 | $1,675 | $20,591 | $3,189 | $17,402 |
| 2019 | $1,624 | $20,084 | $3,189 | $16,895 |
| 2018 | $1,642 | $20,084 | $3,189 | $16,895 |
| 2017 | $1,561 | $20,084 | $3,189 | $16,895 |
| 2016 | $1,517 | $20,084 | $3,189 | $16,895 |
| 2015 | $1,492 | $20,084 | $3,189 | $16,895 |
| 2014 | $2,241 | $20,084 | $3,189 | $16,895 |
| 2013 | $1,516 | $20,084 | $3,189 | $16,895 |
Source: Public Records
Map
Nearby Homes
- 321 Mcdougal St
- 0 W South Route 12
- 203 N Union St
- 133 E South St
- 220 E High St
- 520 N Union St
- 540 N Poplar St
- 348 W South St
- 351 W South St
- 412 E Center St
- 633 Maple St
- 723 N Union St
- 509 College Ave
- 429 S Town St
- 634 W Tiffin St
- 931 N Union St
- 603 N Vine St
- 892 N Countyline St
- 711 Circle Dr
- 900 N Countyline St