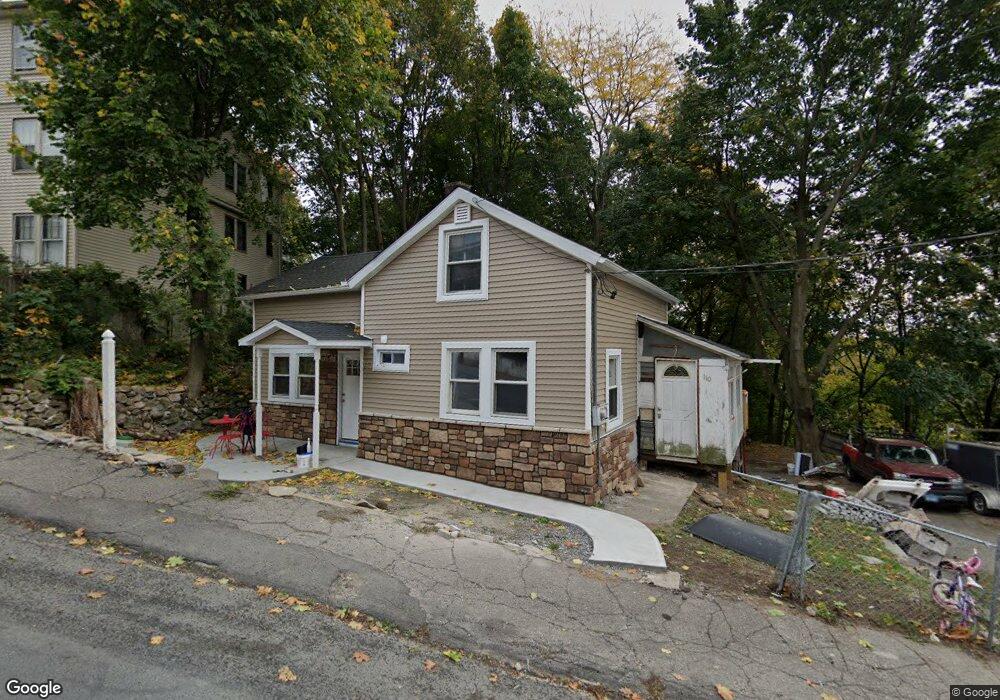
110 Wall St Waterbury, CT 06705
East End District NeighborhoodEstimated Value: $133,000 - $252,000
4
Beds
2
Baths
1,386
Sq Ft
$151/Sq Ft
Est. Value
About This Home
This home is located at 110 Wall St, Waterbury, CT 06705 and is currently estimated at $208,988, approximately $150 per square foot. 110 Wall St is a home located in New Haven County with nearby schools including Woodrow Wilson School, Michael F. Wallace Middle School, and Crosby High School.
Ownership History
Date
Name
Owned For
Owner Type
Purchase Details
Closed on
Jan 24, 2020
Sold by
Ugur Husamettin
Bought by
Solano Cosme and Solano Carmen
Current Estimated Value
Purchase Details
Closed on
Jul 18, 2014
Sold by
Krasniqi Hamit
Bought by
Ugur Jusamettin
Purchase Details
Closed on
Nov 10, 2010
Sold by
Mendelson Efraim
Bought by
Local One Llc
Purchase Details
Closed on
May 18, 2010
Sold by
Hsbc Bank Usa
Bought by
Mcndelson Efraim
Purchase Details
Closed on
Jul 10, 2009
Sold by
Matiz Joaquin and Hsbc Bank Usa
Bought by
Hsbc Bank Usa
Purchase Details
Closed on
Apr 21, 2001
Sold by
Patriot Llc
Bought by
Baskin Jerry
Home Financials for this Owner
Home Financials are based on the most recent Mortgage that was taken out on this home.
Original Mortgage
$62,400
Interest Rate
6.9%
Mortgage Type
Purchase Money Mortgage
Purchase Details
Closed on
Mar 21, 2001
Sold by
Patriot Llc
Bought by
Baskin Jerry
Home Financials for this Owner
Home Financials are based on the most recent Mortgage that was taken out on this home.
Original Mortgage
$62,400
Interest Rate
6.9%
Mortgage Type
Purchase Money Mortgage
Create a Home Valuation Report for This Property
The Home Valuation Report is an in-depth analysis detailing your home's value as well as a comparison with similar homes in the area
Home Values in the Area
Average Home Value in this Area
Purchase History
| Date | Buyer | Sale Price | Title Company |
|---|---|---|---|
| Solano Cosme | $25,000 | None Available | |
| Ugur Jusamettin | $15,000 | -- | |
| Local One Llc | -- | -- | |
| Mcndelson Efraim | $19,900 | -- | |
| Hsbc Bank Usa | -- | -- | |
| Baskin Jerry | $78,000 | -- | |
| Baskin Jerry | $78,000 | -- |
Source: Public Records
Mortgage History
| Date | Status | Borrower | Loan Amount |
|---|---|---|---|
| Previous Owner | Baskin Jerry | $93,500 | |
| Previous Owner | Baskin Jerry | $60,000 | |
| Previous Owner | Baskin Jerry | $62,400 |
Source: Public Records
Tax History Compared to Growth
Tax History
| Year | Tax Paid | Tax Assessment Tax Assessment Total Assessment is a certain percentage of the fair market value that is determined by local assessors to be the total taxable value of land and additions on the property. | Land | Improvement |
|---|---|---|---|---|
| 2025 | $3,703 | $82,320 | $13,020 | $69,300 |
| 2024 | $4,070 | $82,320 | $13,020 | $69,300 |
| 2023 | $4,461 | $82,320 | $13,020 | $69,300 |
| 2022 | $1,429 | $23,730 | $13,010 | $10,720 |
| 2021 | $1,429 | $23,730 | $13,010 | $10,720 |
| 2020 | $1,429 | $23,730 | $13,010 | $10,720 |
| 2019 | $1,429 | $23,730 | $13,010 | $10,720 |
| 2018 | $1,429 | $23,730 | $13,010 | $10,720 |
| 2017 | $1,522 | $25,270 | $13,010 | $12,260 |
| 2016 | $1,522 | $25,270 | $13,010 | $12,260 |
| 2015 | $1,471 | $25,270 | $13,010 | $12,260 |
| 2014 | $1,559 | $26,770 | $13,010 | $13,760 |
Source: Public Records
Map
Nearby Homes
- 102 Wall St
- 114 Wall St
- 105 Wall St
- 109 Wall St
- 101 Wall St
- 97 Wall St
- 122 Wall St
- 121 Wall St
- 121 Wall St Unit 1
- 121 Wall St Unit 2
- 93 Wall St
- 126 Wall St
- 126 Wall St Unit 3rd floor
- 126 Wall St Unit 1st floor
- 103 Catherine Ave
- 103 Catherine Ave Unit 1FL
- 103 Catherine Ave Unit 2FL
- 103 Catherine Ave Unit 2ND
- 93 Catherine Ave