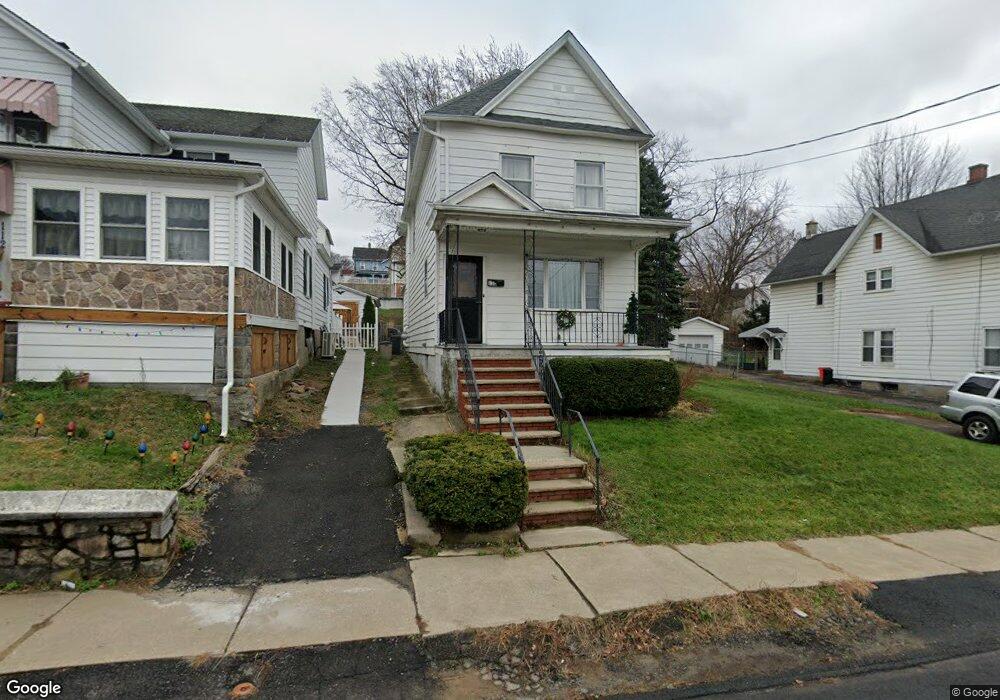
110 Walnut St Dunmore, PA 18512
Estimated Value: $212,000 - $229,077
3
Beds
2
Baths
1,390
Sq Ft
$160/Sq Ft
Est. Value
About This Home
This home is located at 110 Walnut St, Dunmore, PA 18512 and is currently estimated at $222,019, approximately $159 per square foot. 110 Walnut St is a home located in Lackawanna County with nearby schools including Dunmore Elementary Center, St. Mary of Mount Carmel School, and The Children's Cornerstone.
Ownership History
Date
Name
Owned For
Owner Type
Purchase Details
Closed on
May 26, 2010
Sold by
Paulish Eugene
Bought by
Furello Rocco J
Current Estimated Value
Home Financials for this Owner
Home Financials are based on the most recent Mortgage that was taken out on this home.
Original Mortgage
$90,250
Outstanding Balance
$60,959
Interest Rate
5.13%
Mortgage Type
New Conventional
Estimated Equity
$161,060
Purchase Details
Closed on
Aug 22, 2005
Sold by
Penetra Daniel L
Bought by
Paulish Eugene
Home Financials for this Owner
Home Financials are based on the most recent Mortgage that was taken out on this home.
Original Mortgage
$77,600
Interest Rate
5.66%
Mortgage Type
New Conventional
Create a Home Valuation Report for This Property
The Home Valuation Report is an in-depth analysis detailing your home's value as well as a comparison with similar homes in the area
Home Values in the Area
Average Home Value in this Area
Purchase History
| Date | Buyer | Sale Price | Title Company |
|---|---|---|---|
| Furello Rocco J | $95,000 | None Available | |
| Paulish Eugene | $97,000 | None Available |
Source: Public Records
Mortgage History
| Date | Status | Borrower | Loan Amount |
|---|---|---|---|
| Open | Furello Rocco J | $90,250 | |
| Previous Owner | Paulish Eugene | $77,600 |
Source: Public Records
Tax History
| Year | Tax Paid | Tax Assessment Tax Assessment Total Assessment is a certain percentage of the fair market value that is determined by local assessors to be the total taxable value of land and additions on the property. | Land | Improvement |
|---|---|---|---|---|
| 2025 | $2,925 | $9,800 | $1,650 | $8,150 |
| 2024 | $2,500 | $9,800 | $1,650 | $8,150 |
| 2023 | $2,500 | $9,800 | $1,650 | $8,150 |
| 2022 | $2,346 | $9,800 | $1,650 | $8,150 |
| 2021 | $2,299 | $9,800 | $1,650 | $8,150 |
| 2020 | $2,299 | $9,800 | $1,650 | $8,150 |
| 2019 | $2,199 | $9,800 | $1,650 | $8,150 |
| 2018 | $2,162 | $9,800 | $1,650 | $8,150 |
| 2017 | $2,100 | $9,800 | $1,650 | $8,150 |
| 2016 | $1,106 | $9,800 | $1,650 | $8,150 |
| 2015 | -- | $9,800 | $1,650 | $8,150 |
| 2014 | -- | $9,800 | $1,650 | $8,150 |
Source: Public Records
Map
Nearby Homes
- 709 Meade St
- 812 Butler St
- 611 Chestnut St
- 406 3rd St
- 113-115 E Pine St
- 113 E Pine St
- 113 Franklin St
- 225, 233 E 301 East Drinker Stret
- 108 Reeves St
- 1050 Mark Ave
- 609 E Drinker St
- 2025 Delaware St
- 627 S Blakely St
- 640 S 642 S Blakely St
- 200 Sand St
- 2211 Ash St
- 1050 Prescott Ave
- 944 Matthew Ave
- 1017 Prescott Ave
- 837 Matthew Ave
Your Personal Tour Guide
Ask me questions while you tour the home.