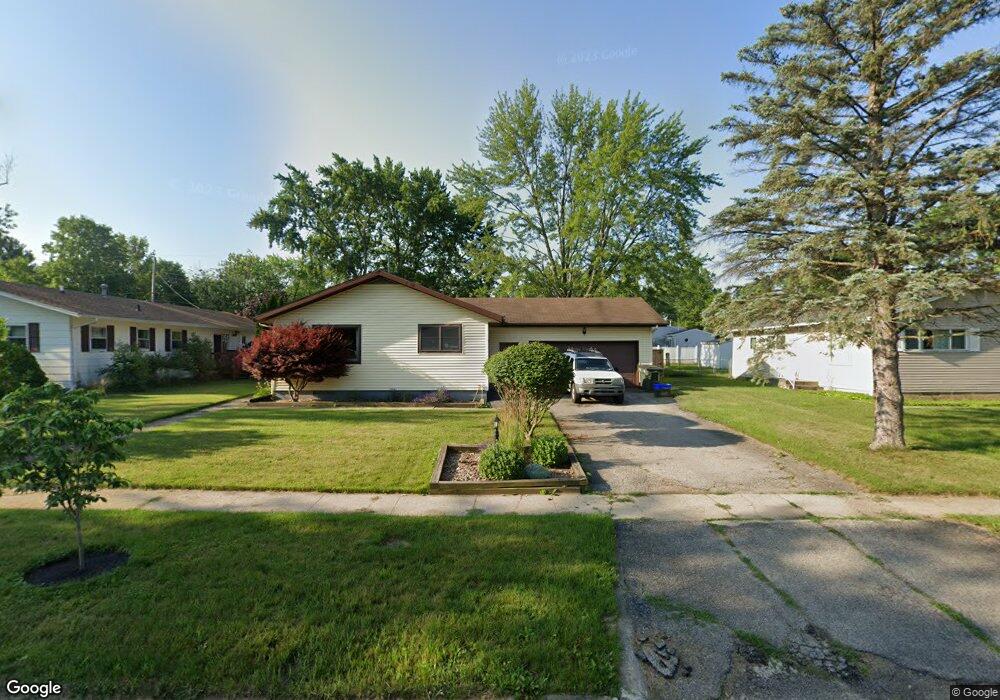
110 Walnut St Three Oaks, MI 49128
Estimated Value: $208,000 - $330,000
3
Beds
1
Bath
1,000
Sq Ft
$261/Sq Ft
Est. Value
About This Home
This home is located at 110 Walnut St, Three Oaks, MI 49128 and is currently estimated at $260,876, approximately $260 per square foot. 110 Walnut St is a home located in Berrien County with nearby schools including River Valley Middle/High School.
Ownership History
Date
Name
Owned For
Owner Type
Purchase Details
Closed on
Sep 10, 2021
Sold by
Barrett Elizabeth L
Bought by
Barrett Elizabeth L and Elizabeth L Barrett Trust
Current Estimated Value
Purchase Details
Closed on
Jul 20, 2010
Sold by
Barrett Mattew P
Bought by
Barrett Lisa M and Barrett Elizabeth L
Home Financials for this Owner
Home Financials are based on the most recent Mortgage that was taken out on this home.
Original Mortgage
$90,000
Interest Rate
4.7%
Mortgage Type
New Conventional
Purchase Details
Closed on
Jan 24, 2008
Sold by
Mortgage Electronic Registration Systems
Bought by
Deutsche Bank National Trust Co and Securitized Asset Backed Receivables Llc
Purchase Details
Closed on
Nov 29, 2007
Sold by
Moser Paul and New Century Mortgage Corp
Bought by
Mortgage Electronic Registration Systems
Purchase Details
Closed on
Nov 3, 2005
Sold by
Scott David H and Bradley Sandra L
Bought by
Moser Paul
Create a Home Valuation Report for This Property
The Home Valuation Report is an in-depth analysis detailing your home's value as well as a comparison with similar homes in the area
Purchase History
| Date | Buyer | Sale Price | Title Company |
|---|---|---|---|
| Barrett Elizabeth L | -- | None Available | |
| Barrett Lisa M | -- | None Available | |
| Deutsche Bank National Trust Co | -- | None Available | |
| Mortgage Electronic Registration Systems | $133,507 | None Available | |
| Moser Paul | $142,000 | None Available |
Source: Public Records
Mortgage History
| Date | Status | Borrower | Loan Amount |
|---|---|---|---|
| Closed | Barrett Lisa M | $90,000 |
Source: Public Records
Tax History
| Year | Tax Paid | Tax Assessment Tax Assessment Total Assessment is a certain percentage of the fair market value that is determined by local assessors to be the total taxable value of land and additions on the property. | Land | Improvement |
|---|---|---|---|---|
| 2025 | $861 | $95,700 | $0 | $0 |
| 2024 | $1,036 | $87,000 | $0 | $0 |
| 2023 | $1,602 | $88,100 | $0 | $0 |
| 2022 | $1,350 | $63,500 | $0 | $0 |
| 2021 | $1,331 | $57,900 | $11,300 | $46,600 |
| 2020 | $1,251 | $42,800 | $0 | $0 |
| 2019 | $1,187 | $36,400 | $2,900 | $33,500 |
| 2018 | $1,167 | $36,400 | $0 | $0 |
| 2017 | $1,308 | $36,677 | $0 | $0 |
| 2016 | $1,282 | $35,987 | $0 | $0 |
| 2015 | $1,325 | $39,381 | $0 | $0 |
| 2014 | $399 | $36,683 | $0 | $0 |
Source: Public Records
Map
Nearby Homes
- 308 N Elm St
- 9 Beech St E
- 106 Beech St E
- 207 Cherry St
- 201 Sycamore St E
- 103 Maple St
- 202 Maple St
- 37 Huckleberry
- 202 S Elm St
- 404 Sherwood Ave
- 7079 U S 12
- 7200 U S 12
- 0 W Elm Valley Rd Unit 25049923
- 8400 Kruger Rd
- 614 Magnolia St
- 616 Magnolia St
- 7081 U S 12
- 7078 Us 12 Hwy W
- 18216 S Schwark Rd
- 14736 Flynn Rd
Your Personal Tour Guide
Ask me questions while you tour the home.