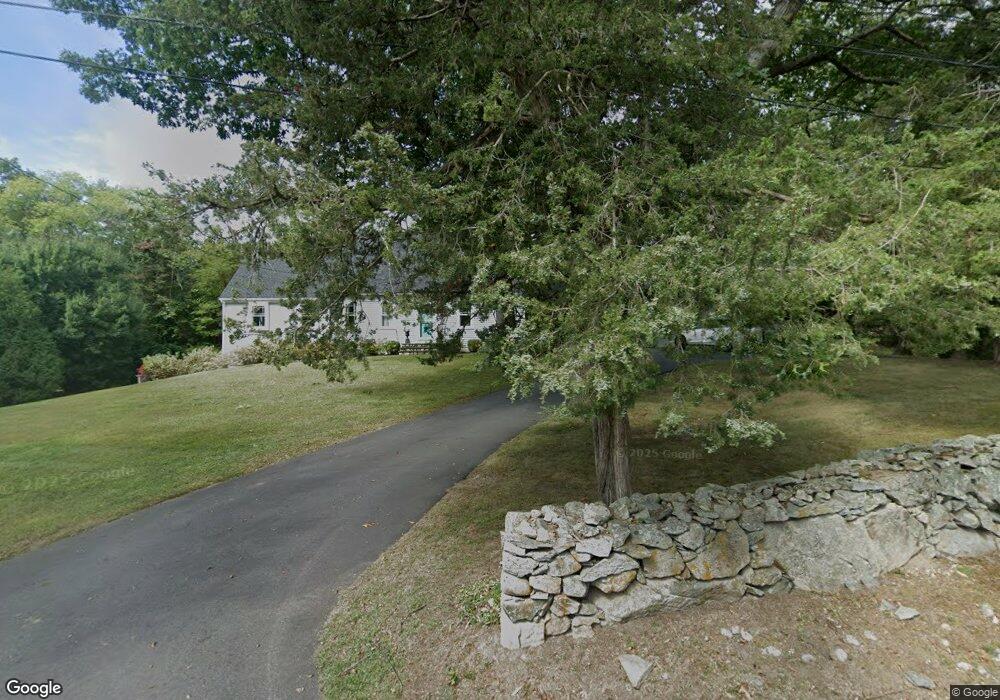
110 Weir St Hingham, MA 02043
Estimated Value: $1,081,000 - $1,627,000
4
Beds
3
Baths
2,499
Sq Ft
$535/Sq Ft
Est. Value
About This Home
This home is located at 110 Weir St, Hingham, MA 02043 and is currently estimated at $1,336,038, approximately $534 per square foot. 110 Weir St is a home located in Plymouth County with nearby schools including East Elementary School, Hingham Middle School, and Hingham High School.
Ownership History
Date
Name
Owned For
Owner Type
Purchase Details
Closed on
Jan 15, 2021
Sold by
Fuda Helen
Bought by
Helen Fuda Irt
Current Estimated Value
Purchase Details
Closed on
Jan 1, 1965
Bought by
Fuda Helen
Create a Home Valuation Report for This Property
The Home Valuation Report is an in-depth analysis detailing your home's value as well as a comparison with similar homes in the area
Purchase History
| Date | Buyer | Sale Price | Title Company |
|---|---|---|---|
| Helen Fuda Irt | -- | None Available | |
| Fuda Helen | -- | -- |
Source: Public Records
Mortgage History
| Date | Status | Borrower | Loan Amount |
|---|---|---|---|
| Previous Owner | Fuda Helen | $60,000 | |
| Previous Owner | Fuda Helen | $67,000 | |
| Previous Owner | Fuda Helen | $30,000 | |
| Previous Owner | Fuda Helen | $12,000 |
Source: Public Records
Tax History
| Year | Tax Paid | Tax Assessment Tax Assessment Total Assessment is a certain percentage of the fair market value that is determined by local assessors to be the total taxable value of land and additions on the property. | Land | Improvement |
|---|---|---|---|---|
| 2025 | $11,540 | $1,079,500 | $451,400 | $628,100 |
| 2024 | $10,964 | $1,010,500 | $451,400 | $559,100 |
| 2023 | $9,355 | $935,500 | $451,400 | $484,100 |
| 2022 | $9,090 | $786,300 | $389,300 | $397,000 |
| 2021 | $8,787 | $744,700 | $389,300 | $355,400 |
| 2020 | $8,586 | $744,700 | $389,300 | $355,400 |
| 2019 | $8,310 | $703,600 | $389,300 | $314,300 |
| 2018 | $7,457 | $633,600 | $389,300 | $244,300 |
| 2017 | $7,466 | $609,500 | $376,000 | $233,500 |
| 2016 | $7,388 | $591,500 | $358,000 | $233,500 |
| 2015 | $7,195 | $574,200 | $340,700 | $233,500 |
Source: Public Records
Map
Nearby Homes
- LOT 1B Rockland St
- 101 Rockland St
- 114 Hull St
- 2 Cliff Rd
- 8 Evergreen Ln
- 166 Hull St
- 1 Rockland St
- 112 Martins Ln
- 9 Barnes Rd
- 23 Wyola Rd
- 82 East St
- 33 Turkey Hill Ln
- 65 East St
- 2 Woodbine Ln
- 22 Berkley Rd Unit B
- 121 Nantasket Ave Unit 503
- 4 Atherton Rd
- 1 Longbeach Ave Unit 202
- 18 Valley Beach Ave
- 14 Cedarledge Village
- 106 Weir St
- 109 Weir St
- 123 Weir St
- 11 Cherry St
- 14 Cherry St
- 29 Canterbury St
- 3 Jordan Way
- 15 Cherry St
- 9 Cherry St
- 111 Weir St
- 4 Foundry Falls Rd
- 132 Weir St
- 2 Cherry St
- 114 Weir St
- Lot 23 Canterbury Village
- LOT 18 Canterbury Village
- 5 Jordan Way
- LOT 16 Canterbury Village
- 3 Canterbury St
- Lot 15 Canterbury Village
Your Personal Tour Guide
Ask me questions while you tour the home.