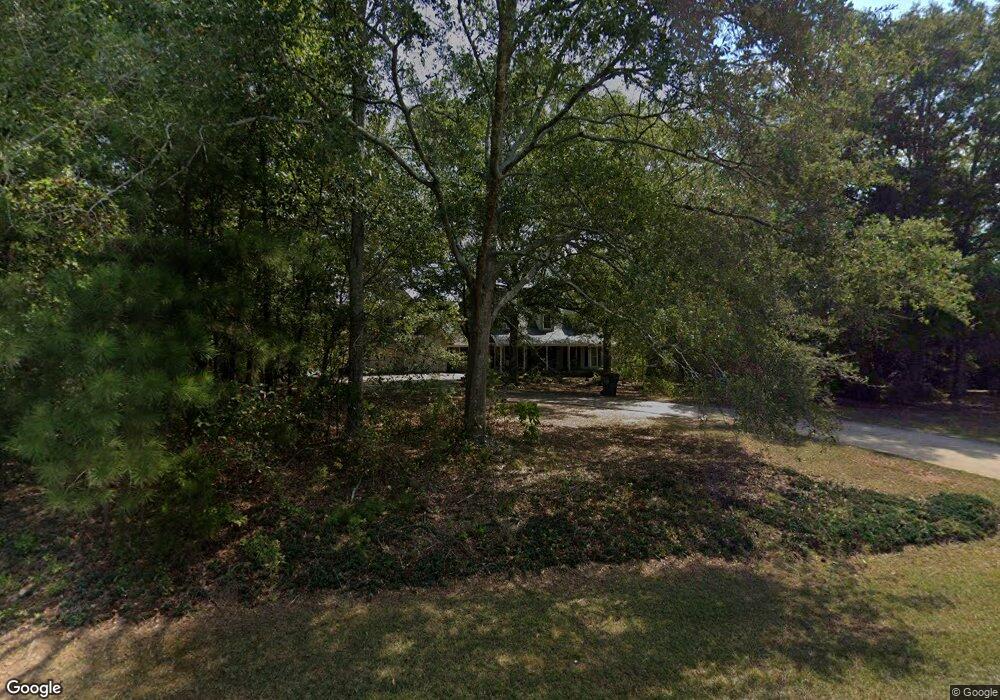
110 Whooping Creek Rd Carrollton, GA 30116
Estimated Value: $236,154 - $253,000
3
Beds
2
Baths
1,232
Sq Ft
$201/Sq Ft
Est. Value
About This Home
This home is located at 110 Whooping Creek Rd, Carrollton, GA 30116 and is currently estimated at $247,039, approximately $200 per square foot. 110 Whooping Creek Rd is a home located in Carroll County with nearby schools including Central Elementary School, Central Middle School, and Central High School.
Ownership History
Date
Name
Owned For
Owner Type
Purchase Details
Closed on
Aug 29, 2017
Sold by
Brown Michael
Bought by
Dixson Brittany Ann
Current Estimated Value
Home Financials for this Owner
Home Financials are based on the most recent Mortgage that was taken out on this home.
Original Mortgage
$109,971
Outstanding Balance
$91,461
Interest Rate
3.75%
Mortgage Type
FHA
Estimated Equity
$155,578
Purchase Details
Closed on
Aug 31, 2016
Sold by
John
Bought by
Brown Michael and Holder Brown Holly
Home Financials for this Owner
Home Financials are based on the most recent Mortgage that was taken out on this home.
Original Mortgage
$81,987
Interest Rate
3.5%
Mortgage Type
FHA
Purchase Details
Closed on
Jan 26, 2006
Sold by
Popphan John
Bought by
Popphan John
Purchase Details
Closed on
Aug 12, 1998
Sold by
Costley Donald C
Bought by
Popphan John
Purchase Details
Closed on
Aug 15, 1995
Bought by
Costley Donald C
Create a Home Valuation Report for This Property
The Home Valuation Report is an in-depth analysis detailing your home's value as well as a comparison with similar homes in the area
Home Values in the Area
Average Home Value in this Area
Purchase History
| Date | Buyer | Sale Price | Title Company |
|---|---|---|---|
| Dixson Brittany Ann | $112,000 | -- | |
| Brown Michael | $83,500 | -- | |
| Popphan John | -- | -- | |
| Popphan John | $8,000 | -- | |
| Costley Donald C | $5,000 | -- |
Source: Public Records
Mortgage History
| Date | Status | Borrower | Loan Amount |
|---|---|---|---|
| Open | Dixson Brittany Ann | $109,971 | |
| Previous Owner | Brown Michael | $81,987 |
Source: Public Records
Tax History Compared to Growth
Tax History
| Year | Tax Paid | Tax Assessment Tax Assessment Total Assessment is a certain percentage of the fair market value that is determined by local assessors to be the total taxable value of land and additions on the property. | Land | Improvement |
|---|---|---|---|---|
| 2024 | $1,469 | $79,623 | $14,112 | $65,511 |
| 2023 | $1,469 | $70,882 | $11,290 | $59,592 |
| 2022 | $1,184 | $55,368 | $7,526 | $47,842 |
| 2021 | $1,063 | $47,079 | $6,021 | $41,058 |
| 2020 | $965 | $41,607 | $5,474 | $36,133 |
| 2019 | $993 | $38,381 | $5,474 | $32,907 |
| 2018 | $757 | $28,810 | $3,868 | $24,942 |
| 2017 | $759 | $28,810 | $3,868 | $24,942 |
| 2016 | $759 | $28,810 | $3,868 | $24,942 |
| 2015 | $825 | $29,498 | $6,000 | $23,498 |
| 2014 | $828 | $29,498 | $6,000 | $23,498 |
Source: Public Records
Map
Nearby Homes
- 977 Whooping Creek Rd
- 50 Azalea Trail
- 420 Whooping Creek Rd
- 605 Whooping Creek Rd
- 587 Whooping Creek Rd
- 703 Central High Rd
- 400 Stripling Chapel Rd
- 50 Sue Alice Ln
- Plan 1643 at Windmill Park
- Plan 1830 at Windmill Park
- 203 Vineyard Walk Unit LOT 74
- Plan 2030 at Windmill Park
- 203 Vineyard Walk
- Plan 1727 at Windmill Park
- Plan 1400 at Windmill Park
- 113 Vineyard Walk
- 113 Vineyard Walk Unit LOT 77
- 111 Vineyard Walk
- 111 Vineyard Walk Unit LOT 78
- 135 Gray Rd
- 110 Whooping Creek Rd Unit B
- 110 Whooping Creek Rd
- 130 Whooping Creek Rd
- 115 Whooping Creek Rd
- 90 Whooping Creek Rd
- 150 Whooping Creek Rd
- 312 Primary School Rd
- 1975 Whooping Creek Rd
- 977 Whooping Creek Rd Unit 5
- TRACT Whooping Creek Rd
- 82 Whooping Creek Rd
- 170 Whooping Creek Rd
- 236 Whooping Creek Rd
- 180 Whooping Creek Rd
- 145 Tara Dr
- 0 Tara Dr Unit 8801540
- 0 Whooping Creek Rd
- 0000 Whooping Creek Rd
- 0 Whooping Creek Rd Unit 10135304
- 0 Whooping Creek Rd Unit 7104913