Estimated Value: $248,161 - $292,000
3
Beds
2
Baths
2,381
Sq Ft
$111/Sq Ft
Est. Value
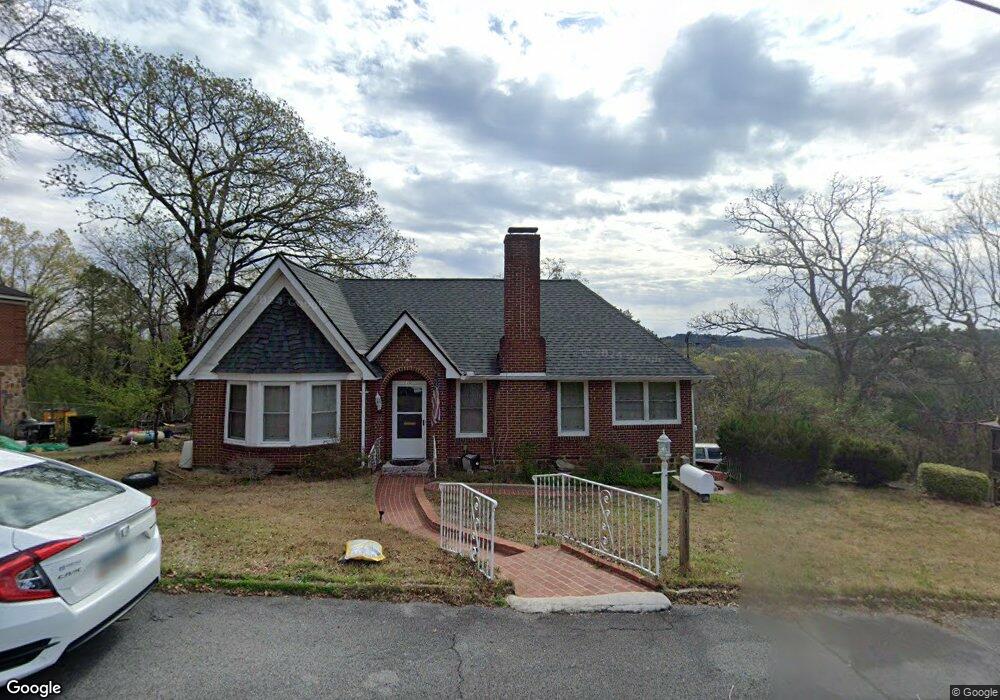
About This Home
This home is located at 110 Woodcrest Dr SW, Rome, GA 30161 and is currently estimated at $264,040, approximately $110 per square foot. 110 Woodcrest Dr SW is a home located in Floyd County with nearby schools including Dan McCarty Middle School, Rome High School, and Darlington School.
Ownership History
Date
Name
Owned For
Owner Type
Purchase Details
Closed on
Mar 2, 2020
Sold by
Brewer Delores A
Bought by
Bush George I
Current Estimated Value
Home Financials for this Owner
Home Financials are based on the most recent Mortgage that was taken out on this home.
Original Mortgage
$21,000
Interest Rate
3.6%
Mortgage Type
New Conventional
Purchase Details
Closed on
Apr 26, 2018
Sold by
Aiken
Bought by
Brewer Delores A
Purchase Details
Closed on
Aug 2, 1978
Sold by
Aiken John Holland and Naomi Ione
Bought by
Aiken John Holland
Purchase Details
Closed on
Jun 4, 1976
Sold by
Cade Charles R
Bought by
Aiken John Holland and Naomi Ione
Purchase Details
Closed on
Oct 24, 1975
Sold by
Crumbley Ellen P
Bought by
Cade Charles R
Purchase Details
Closed on
Oct 1, 1973
Sold by
Pierce Frank
Bought by
Crumbley Ellen P
Purchase Details
Closed on
Jan 1, 1962
Sold by
Hardin Homer C
Bought by
Pierce Frank
Purchase Details
Closed on
Jan 1, 1901
Bought by
Hardin Homer C
Create a Home Valuation Report for This Property
The Home Valuation Report is an in-depth analysis detailing your home's value as well as a comparison with similar homes in the area
Home Values in the Area
Average Home Value in this Area
Purchase History
| Date | Buyer | Sale Price | Title Company |
|---|---|---|---|
| Bush George I | $141,000 | -- | |
| Brewer Delores A | $119,500 | -- | |
| Aiken John Holland | -- | -- | |
| Aiken John Holland | $30,000 | -- | |
| Cade Charles R | $26,500 | -- | |
| Crumbley Ellen P | -- | -- | |
| Pierce Frank | -- | -- | |
| Hardin Homer C | -- | -- |
Source: Public Records
Mortgage History
| Date | Status | Borrower | Loan Amount |
|---|---|---|---|
| Closed | Bush George I | $21,000 |
Source: Public Records
Tax History Compared to Growth
Tax History
| Year | Tax Paid | Tax Assessment Tax Assessment Total Assessment is a certain percentage of the fair market value that is determined by local assessors to be the total taxable value of land and additions on the property. | Land | Improvement |
|---|---|---|---|---|
| 2024 | $3,688 | $83,906 | $10,120 | $73,786 |
| 2023 | $2,971 | $79,789 | $9,200 | $70,589 |
| 2022 | $2,377 | $65,139 | $7,360 | $57,779 |
| 2021 | $2,181 | $58,771 | $7,360 | $51,411 |
| 2020 | $1,960 | $52,384 | $5,750 | $46,634 |
| 2019 | $1,769 | $49,292 | $5,750 | $43,542 |
| 2018 | $1,438 | $38,861 | $5,750 | $33,111 |
| 2017 | $1,456 | $39,316 | $5,750 | $33,566 |
| 2016 | $708 | $38,418 | $5,720 | $32,698 |
| 2015 | -- | $38,418 | $5,720 | $32,698 |
| 2014 | -- | $38,418 | $5,720 | $32,698 |
Source: Public Records
Map
Nearby Homes
- 115 Lookout Cir SW
- 113 Lookout Cir SW
- 111 Lookout Cir SW
- 13 N Blanche Ave SW
- 515 S Broad St SW
- 5 Jervis St SW
- 515 Harper Ave SW
- 702 River Ave SW
- 2 Coral Ave SW
- 107 Butler St SW
- 2 Fair St SW
- 232 S Broad St SW
- 2 E 10th St SW
- 529 Branham Ave SW
- 3 Grover St SW
- 801 Maple Ave SW
- 316 S McLin St SW
- 3 Porter St SW
- 112 Woodcrest Dr SW
- 108 Woodcrest Dr SW
- 111 Woodcrest Dr SW
- 109 Woodcrest Dr SW
- 114 Woodcrest Dr SW
- 113 Woodcrest Dr SW
- 107 Woodcrest Dr SW
- 103 Woodcrest Dr SW
- 116 Woodcrest Dr SW
- 106 Woodcrest Dr SW
- 115 Woodcrest Dr SW
- 101 Woodcrest Dr SW
- 118 Woodcrest Dr SW
- 117 Woodcrest Dr SW
- 104 Woodcrest Dr SW
- 100 Woodcrest Dr SW
- 0 Woodcrest Dr SW Unit 8639183
- 0 Woodcrest Dr SW Unit 7137968
- 102 Woodcrest Dr SW
- 3 Woodcrest Dr SW