110 Wray St Warner Robins, GA 31093
Estimated Value: $39,000 - $241,000
--
Bed
--
Bath
--
Sq Ft
8,712
Sq Ft Lot
About This Home
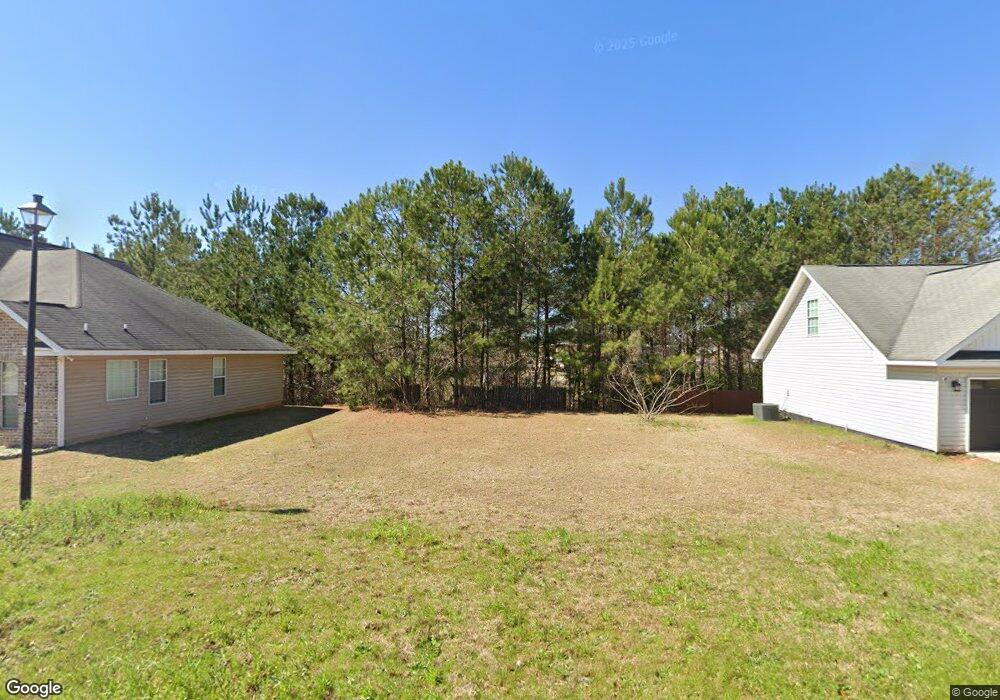
This home is located at 110 Wray St, Warner Robins, GA 31093 and is currently estimated at $90,096. 110 Wray St is a home located in Houston County with nearby schools including Westside Elementary School, Northside Middle School, and Northside High School.
Ownership History
Date
Name
Owned For
Owner Type
Purchase Details
Closed on
Dec 27, 2010
Sold by
Alpine Valley Properties Llc
Bought by
Carranza Francisco J
Current Estimated Value
Purchase Details
Closed on
Sep 27, 2010
Sold by
State Bank & Trust Company
Bought by
Alpine Valley Properties Llc
Purchase Details
Closed on
Sep 5, 2008
Sold by
Monte Carlo Homes Inc
Bought by
Security Bank Of Houston County
Purchase Details
Closed on
Dec 7, 2006
Sold by
Hcb Properties Llc
Bought by
Monte Carlo Homes Inc
Home Financials for this Owner
Home Financials are based on the most recent Mortgage that was taken out on this home.
Original Mortgage
$26,884
Interest Rate
6.36%
Mortgage Type
Purchase Money Mortgage
Create a Home Valuation Report for This Property
The Home Valuation Report is an in-depth analysis detailing your home's value as well as a comparison with similar homes in the area
Home Values in the Area
Average Home Value in this Area
Purchase History
| Date | Buyer | Sale Price | Title Company |
|---|---|---|---|
| Carranza Francisco J | $7,500 | None Available | |
| Alpine Valley Properties Llc | $4,600 | None Available | |
| State Bank & Trust Company | -- | None Available | |
| Security Bank Of Houston County | $27,000 | None Available | |
| Monte Carlo Homes Inc | $26,500 | None Available |
Source: Public Records
Mortgage History
| Date | Status | Borrower | Loan Amount |
|---|---|---|---|
| Previous Owner | Monte Carlo Homes Inc | $26,884 |
Source: Public Records
Tax History Compared to Growth
Tax History
| Year | Tax Paid | Tax Assessment Tax Assessment Total Assessment is a certain percentage of the fair market value that is determined by local assessors to be the total taxable value of land and additions on the property. | Land | Improvement |
|---|---|---|---|---|
| 2024 | $136 | $3,920 | $3,920 | $0 |
| 2023 | $137 | $3,920 | $3,920 | $0 |
| 2022 | $69 | $3,000 | $3,000 | $0 |
| 2021 | $69 | $3,000 | $3,000 | $0 |
| 2020 | $96 | $2,960 | $2,960 | $0 |
| 2019 | $69 | $2,960 | $2,960 | $0 |
| 2018 | $69 | $2,960 | $2,960 | $0 |
| 2017 | $69 | $2,960 | $2,960 | $0 |
| 2016 | $69 | $2,960 | $2,960 | $0 |
| 2015 | $69 | $2,960 | $2,960 | $0 |
| 2014 | -- | $3,960 | $3,960 | $0 |
| 2013 | -- | $4,840 | $4,840 | $0 |
Source: Public Records
Map
Nearby Homes