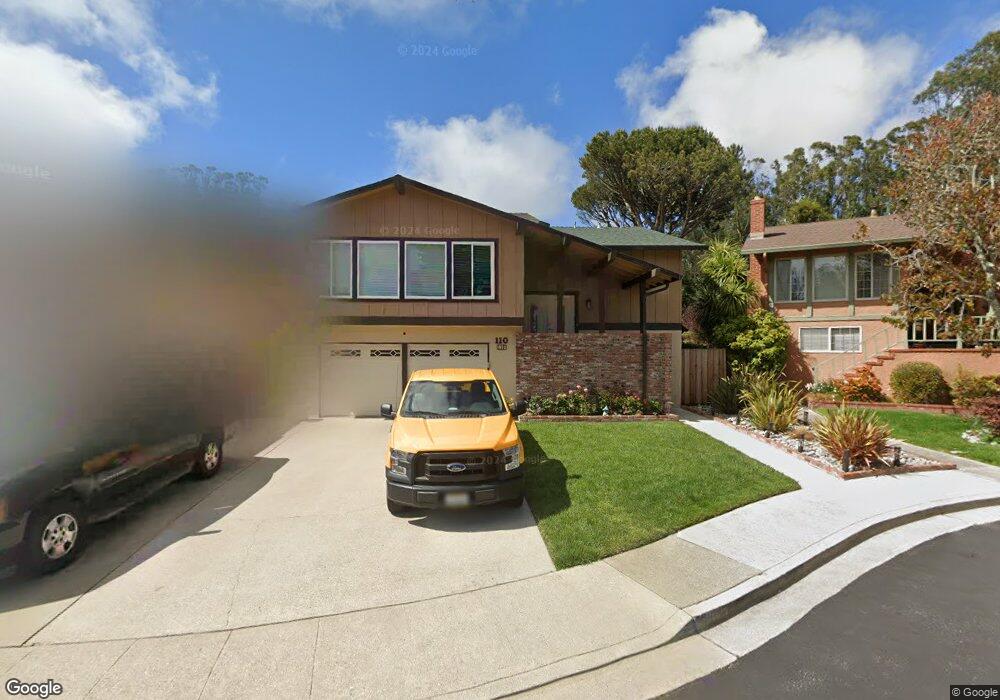
110 Yolo Ct San Bruno, CA 94066
Portola Highlands NeighborhoodEstimated Value: $1,348,000 - $1,634,000
About This Home
This home is located at 110 Yolo Ct, San Bruno, CA 94066 and is currently estimated at $1,466,047, approximately $1,025 per square foot. 110 Yolo Ct is a home located in San Mateo County with nearby schools including Portola Elementary School, Parkside Intermediate School, and Capuchino High School.
Ownership History
We collect this data history from publicly available records. To have your information removed, we recommend requesting removal directly through your county’s website.
Purchase Details
Home Financials for this Owner
Home Financials are based on the most recent Mortgage that was taken out on this home.Home Values in the Area
Average Home Value in this Area
Purchase History
We collect this data history from publicly available records. To have your information removed, we recommend requesting removal directly through your county’s website.
| Date | Buyer | Sale Price | Title Company |
|---|---|---|---|
| -- | Fidelity National Title Co | ||
| -- | Fidelity National Title Co |
Mortgage History
We collect this data history from publicly available records. To have your information removed, we recommend requesting removal directly through your county’s website.
| Date | Status | Borrower | Loan Amount |
|---|---|---|---|
| Open | $150,000 | ||
| Closed | $100,000 | ||
| Closed | $50,000 | ||
| Closed | $95,000 | ||
| Previous Owner | $95,000 | ||
| Previous Owner | $99,300 |
Tax History
We collect this data history from publicly available records. To have your information removed, we recommend requesting removal directly through your county’s website.
| Year | Tax Paid | Tax Assessment Tax Assessment Total Assessment is a certain percentage of the fair market value that is determined by local assessors to be the total taxable value of land and additions on the property. | Land | Improvement |
|---|---|---|---|---|
| 2025 | $7,040 | $574,684 | $287,342 | $287,342 |
| 2023 | $7,040 | $552,370 | $276,185 | $276,185 |
| 2022 | $6,057 | $541,540 | $270,770 | $270,770 |
| 2021 | $5,979 | $530,922 | $265,461 | $265,461 |
| 2020 | $5,923 | $525,480 | $262,740 | $262,740 |
| 2019 | $5,827 | $515,178 | $257,589 | $257,589 |
| 2018 | $5,539 | $505,078 | $252,539 | $252,539 |
| 2017 | $5,481 | $495,176 | $247,588 | $247,588 |
| 2016 | $5,367 | $485,468 | $242,734 | $242,734 |
| 2015 | $5,296 | $478,176 | $239,088 | $239,088 |
| 2014 | $5,219 | $468,810 | $234,405 | $234,405 |
Map
- 3169 Moreland Dr
- 2601 Evergreen Dr
- 2600 Evergreen Dr
- 3011 Fasman Dr
- 2361 Oakmont Dr
- 2501 Sherwood Dr
- 2351 Rollingwood Dr
- 3392 Fleetwood Dr
- 47 Seville Way
- 2306 Valleywood Dr
- 2271 Fleetwood Dr
- 940 Glenview Dr
- 1380 Claremont Dr
- 2991 Medina Dr
- 56 Waverly Ct
- 55 Buena Vista Rd
- 356 View Point Ct
- 39 Appian Way Unit C
- 3981 Chilton Ln
- 2504 Ardee Ln
Ask me questions while you tour the home.