1100 Calais Dr Southlake, TX 76092
Estimated Value: $1,224,000 - $1,392,000
4
Beds
4
Baths
4,072
Sq Ft
$321/Sq Ft
Est. Value
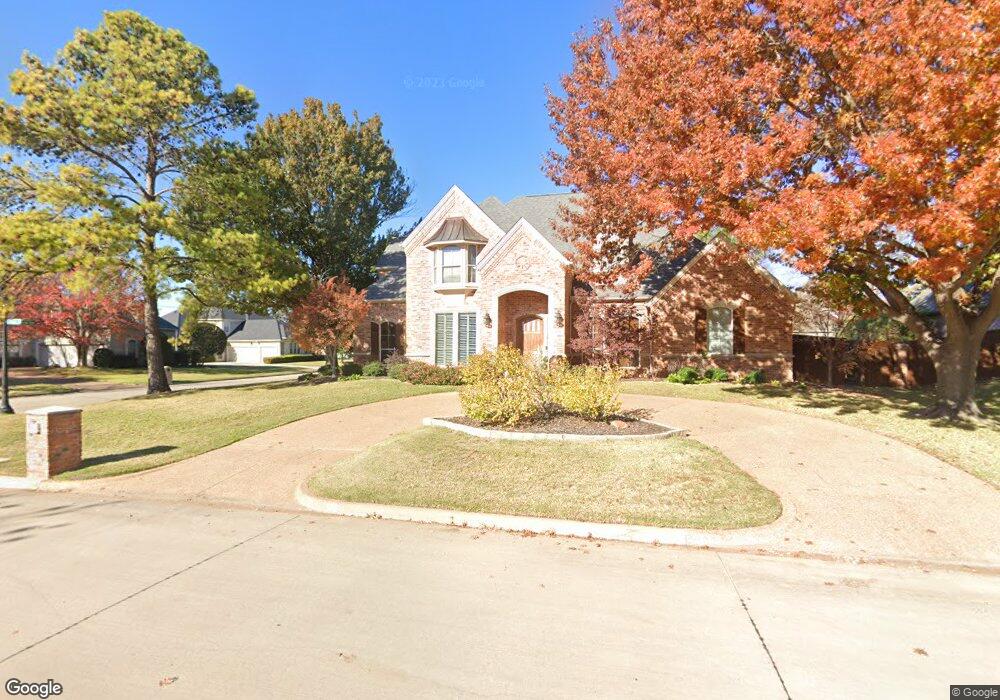
About This Home
This home is located at 1100 Calais Dr, Southlake, TX 76092 and is currently estimated at $1,306,642, approximately $320 per square foot. 1100 Calais Dr is a home located in Tarrant County with nearby schools including Old Union Elementary School, Eubanks Intermediate School, and George Dawson Middle School.
Ownership History
Date
Name
Owned For
Owner Type
Purchase Details
Closed on
Jun 3, 2019
Sold by
Campanello John B and Campanello Laura
Bought by
Kaba Enver and Kaba Resmije D
Current Estimated Value
Home Financials for this Owner
Home Financials are based on the most recent Mortgage that was taken out on this home.
Original Mortgage
$708,750
Outstanding Balance
$624,415
Interest Rate
4.2%
Mortgage Type
New Conventional
Estimated Equity
$682,227
Purchase Details
Closed on
Nov 23, 1998
Sold by
Benco Homes Inc
Bought by
Campanello John B and Campanello Laura
Home Financials for this Owner
Home Financials are based on the most recent Mortgage that was taken out on this home.
Original Mortgage
$205,000
Interest Rate
6.37%
Purchase Details
Closed on
Apr 24, 1998
Sold by
Versailles Ltd
Bought by
Benco Homes Inc
Home Financials for this Owner
Home Financials are based on the most recent Mortgage that was taken out on this home.
Original Mortgage
$288,000
Interest Rate
7.09%
Create a Home Valuation Report for This Property
The Home Valuation Report is an in-depth analysis detailing your home's value as well as a comparison with similar homes in the area
Home Values in the Area
Average Home Value in this Area
Purchase History
| Date | Buyer | Sale Price | Title Company |
|---|---|---|---|
| Kaba Enver | -- | Freedom Title | |
| Campanello John B | -- | Safeco Land Title | |
| Benco Homes Inc | -- | Safeco Land Title |
Source: Public Records
Mortgage History
| Date | Status | Borrower | Loan Amount |
|---|---|---|---|
| Open | Kaba Enver | $708,750 | |
| Previous Owner | Campanello John B | $205,000 | |
| Previous Owner | Benco Homes Inc | $288,000 |
Source: Public Records
Tax History Compared to Growth
Tax History
| Year | Tax Paid | Tax Assessment Tax Assessment Total Assessment is a certain percentage of the fair market value that is determined by local assessors to be the total taxable value of land and additions on the property. | Land | Improvement |
|---|---|---|---|---|
| 2025 | $12,815 | $1,081,449 | $271,200 | $810,249 |
| 2024 | $12,815 | $1,247,056 | $271,200 | $975,856 |
| 2023 | $14,154 | $1,363,850 | $271,200 | $1,092,650 |
| 2022 | $15,230 | $992,301 | $180,800 | $811,501 |
| 2021 | $14,632 | $769,207 | $180,800 | $588,407 |
| 2020 | $13,411 | $583,424 | $162,720 | $420,704 |
| 2019 | $17,741 | $767,786 | $150,000 | $617,786 |
| 2018 | $15,188 | $666,050 | $150,000 | $516,050 |
| 2017 | $16,039 | $647,094 | $150,000 | $497,094 |
| 2016 | $15,963 | $644,027 | $150,000 | $494,027 |
| 2015 | $13,705 | $623,851 | $90,000 | $533,851 |
| 2014 | $13,705 | $566,300 | $90,000 | $476,300 |
Source: Public Records
Map
Nearby Homes
- 1012 Cool River Dr
- 1100 La Paloma Ct
- 1401 Chardonnay Ct
- 710 Longford Dr
- 702 Sussex Ct
- 708 Nettleton Dr
- 1304 Kings Brook Ct
- 712 Ashleigh Ln
- 223 Westwood Dr
- 1206 Timberline Ct
- 1032 Rosavine Dr
- 1028 Rosavine Dr
- 1017 Rosavine Dr
- 1004 Rosavine Dr
- 1020 Rosavine Dr
- 1012 Rosavine Dr
- 1024 Rosavine Dr
- 1005 Rosavine Dr
- 1016 Rosavine Dr
- 1008 Rosavine Dr
- 1102 Calais Dr
- 1101 Versailles Ct
- 604 Lorraine Dr
- 1103 Versailles Ct
- 607 Lorraine Dr
- 602 Lorraine Dr
- 1104 Calais Dr
- 606 Lorraine Dr
- 1105 Versailles Ct
- 700 Verdun Ct
- 600 Lorraine Dr
- 608 Lorraine Dr
- 609 Lorraine Dr
- 1106 Calais Dr
- 610 Lorraine Dr
- 1100 Versailles Ct
- 702 Verdun Ct
- 1102 Versailles Ct
- 1107 Versailles Ct
- 790 S Carroll Ave