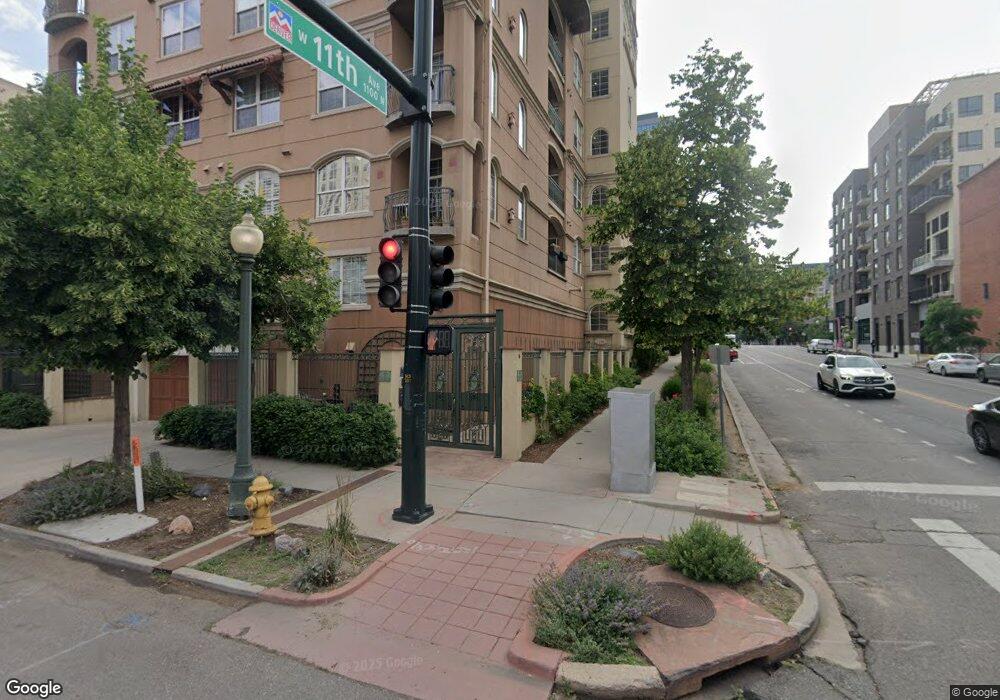
1100 Cherokee St Unit 502 Denver, CO 80204
Golden Triangle NeighborhoodEstimated Value: $595,544 - $792,000
2
Beds
2
Baths
1,665
Sq Ft
$403/Sq Ft
Est. Value
About This Home
This home is located at 1100 Cherokee St Unit 502, Denver, CO 80204 and is currently estimated at $671,136, approximately $403 per square foot. 1100 Cherokee St Unit 502 is a home located in Denver County with nearby schools including Dora Moore ECE-8 School, Kepner Beacon Middle School, and West High School.
Ownership History
Date
Name
Owned For
Owner Type
Purchase Details
Closed on
Apr 24, 2014
Sold by
Vanness Bradley
Bought by
Bouchard Stephen Isaac and Bouchard Heather D
Current Estimated Value
Home Financials for this Owner
Home Financials are based on the most recent Mortgage that was taken out on this home.
Original Mortgage
$374,000
Interest Rate
4.23%
Mortgage Type
New Conventional
Purchase Details
Closed on
Mar 10, 2006
Sold by
Helm Terry and Helm Sheri
Bought by
Vanness Bradley
Purchase Details
Closed on
Apr 26, 1999
Sold by
Trieste Development Llc
Bought by
Helm Terry and Helm Sheri
Home Financials for this Owner
Home Financials are based on the most recent Mortgage that was taken out on this home.
Original Mortgage
$150,000
Interest Rate
7.07%
Create a Home Valuation Report for This Property
The Home Valuation Report is an in-depth analysis detailing your home's value as well as a comparison with similar homes in the area
Home Values in the Area
Average Home Value in this Area
Purchase History
| Date | Buyer | Sale Price | Title Company |
|---|---|---|---|
| Bouchard Stephen Isaac | $467,500 | First American | |
| Vanness Bradley | $474,000 | None Available | |
| Helm Terry | $331,209 | -- |
Source: Public Records
Mortgage History
| Date | Status | Borrower | Loan Amount |
|---|---|---|---|
| Previous Owner | Bouchard Stephen Isaac | $374,000 | |
| Previous Owner | Helm Terry | $150,000 |
Source: Public Records
Tax History Compared to Growth
Tax History
| Year | Tax Paid | Tax Assessment Tax Assessment Total Assessment is a certain percentage of the fair market value that is determined by local assessors to be the total taxable value of land and additions on the property. | Land | Improvement |
|---|---|---|---|---|
| 2024 | $3,239 | $40,890 | $5,000 | $35,890 |
| 2023 | $3,168 | $40,890 | $5,000 | $35,890 |
| 2022 | $3,374 | $42,430 | $8,190 | $34,240 |
| 2021 | $3,256 | $43,640 | $8,420 | $35,220 |
| 2020 | $3,052 | $41,140 | $4,040 | $37,100 |
| 2019 | $2,967 | $41,140 | $4,040 | $37,100 |
| 2018 | $3,382 | $43,720 | $3,390 | $40,330 |
| 2017 | $3,372 | $43,720 | $3,390 | $40,330 |
| 2016 | $3,520 | $43,170 | $3,192 | $39,978 |
| 2015 | $3,373 | $43,170 | $3,192 | $39,978 |
| 2014 | $2,993 | $36,040 | $2,253 | $33,787 |
Source: Public Records
Map
Nearby Homes
- 1090 Cherokee St Unit 301
- 1100 Cherokee St Unit 304
- 300 W 11th Ave Unit 5I
- 300 W 11th Ave Unit 18C
- 300 W 11th Ave Unit 5B
- 300 W 11th Ave Unit 6H
- 300 W 11th Ave Unit 10G
- 300 W 11th Ave Unit 10C
- 1140 Cherokee St Unit 401
- 290 W 12th Ave Unit 205
- 1200 Cherokee St Unit 206
- 1014 Acoma St
- 475 W 12th Ave Unit 11A
- 475 W 12th Ave Unit 6B
- 55 W 12th Ave Unit 408
- 1200 Acoma St Unit 303
- 930 Acoma St Unit 212
- 601 W 11th Ave Unit 409
- 601 W 11th Ave Unit 910
- 1303 Delaware St
- 1100 Cherokee St Unit 804
- 1100 Cherokee St Unit 803
- 1100 Cherokee St Unit 802
- 1100 Cherokee St Unit 801
- 1100 Cherokee St
- 1100 Cherokee St Unit 703
- 1100 Cherokee St Unit 702
- 1100 Cherokee St Unit 701
- 1100 Cherokee St Unit 604
- 1100 Cherokee St Unit 603
- 1100 Cherokee St Unit 602
- 1100 Cherokee St Unit 601
- 1100 Cherokee St Unit 504
- 1100 Cherokee St Unit 503
- 1100 Cherokee St Unit 501
- 1100 Cherokee St Unit 404
- 1100 Cherokee St Unit 403
- 1100 Cherokee St Unit 402
- 1100 Cherokee St Unit 303
- 1100 Cherokee St