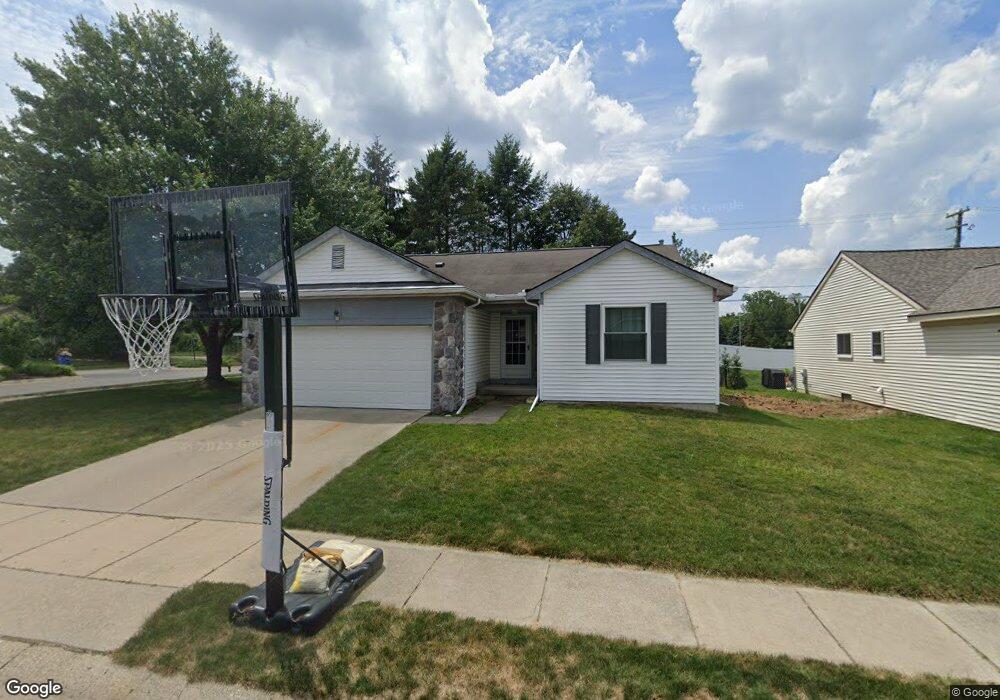
1100 Dartmouth Ln Waterford, MI 48327
Waterford Township NeighborhoodEstimated Value: $296,000 - $387,000
3
Beds
3
Baths
1,376
Sq Ft
$238/Sq Ft
Est. Value
About This Home
This home is located at 1100 Dartmouth Ln, Waterford, MI 48327 and is currently estimated at $327,557, approximately $238 per square foot. 1100 Dartmouth Ln is a home located in Oakland County with nearby schools including Beaumont Elementary School, Pierce Middle School, and Waterford Mott High School.
Ownership History
Date
Name
Owned For
Owner Type
Purchase Details
Closed on
Oct 22, 2016
Sold by
Koyl Nathan
Bought by
Koyl Nathan and Koyl Lynn
Current Estimated Value
Home Financials for this Owner
Home Financials are based on the most recent Mortgage that was taken out on this home.
Original Mortgage
$120,000
Outstanding Balance
$56,288
Interest Rate
3.48%
Mortgage Type
New Conventional
Estimated Equity
$271,269
Purchase Details
Closed on
Aug 15, 2000
Sold by
Household Finance Corp I
Bought by
Boyle Hugh A
Purchase Details
Closed on
Nov 2, 1999
Sold by
Hockstad Helen
Bought by
Nationsbanc Mortgage Corp
Purchase Details
Closed on
Aug 9, 1995
Sold by
American Quality Homes I
Bought by
Hocksad Helen
Home Financials for this Owner
Home Financials are based on the most recent Mortgage that was taken out on this home.
Original Mortgage
$119,850
Interest Rate
7.51%
Mortgage Type
New Conventional
Create a Home Valuation Report for This Property
The Home Valuation Report is an in-depth analysis detailing your home's value as well as a comparison with similar homes in the area
Home Values in the Area
Average Home Value in this Area
Purchase History
| Date | Buyer | Sale Price | Title Company |
|---|---|---|---|
| Koyl Nathan | -- | None Available | |
| Boyle Hugh A | $159,080 | -- | |
| Nationsbanc Mortgage Corp | $122,209 | -- | |
| Hocksad Helen | $126,177 | -- |
Source: Public Records
Mortgage History
| Date | Status | Borrower | Loan Amount |
|---|---|---|---|
| Open | Koyl Nathan | $120,000 | |
| Previous Owner | Hocksad Helen | $119,850 |
Source: Public Records
Tax History Compared to Growth
Tax History
| Year | Tax Paid | Tax Assessment Tax Assessment Total Assessment is a certain percentage of the fair market value that is determined by local assessors to be the total taxable value of land and additions on the property. | Land | Improvement |
|---|---|---|---|---|
| 2024 | $1,499 | $127,560 | $0 | $0 |
| 2023 | $1,430 | $119,540 | $0 | $0 |
| 2022 | $2,304 | $111,160 | $0 | $0 |
| 2021 | $2,177 | $103,350 | $0 | $0 |
| 2020 | $1,309 | $99,690 | $0 | $0 |
| 2019 | $2,128 | $86,790 | $0 | $0 |
| 2018 | $2,111 | $78,660 | $0 | $0 |
| 2017 | $1,941 | $78,660 | $0 | $0 |
| 2016 | $1,938 | $74,720 | $0 | $0 |
| 2015 | -- | $69,050 | $0 | $0 |
| 2014 | -- | $65,190 | $0 | $0 |
| 2011 | -- | $54,320 | $0 | $0 |
Source: Public Records
Map
Nearby Homes
- 1314 Lilac Ln Unit 136
- 7053 Magnolia Ln
- 7244 Lavender Ln Unit 43
- 7040 Villa Dr Unit 2
- 9999 Cooley Lake Rd
- 1150 Jay St
- 1276 Jay St Unit 6
- VL Tamson St
- VAC Mercedes Ave
- 1604 Petrolia
- 1481 Lochaven Rd
- 7377 Cooley Lake Rd
- 7666 Woodview Dr Unit 11
- 1644 Marylestone Dr
- 1630 Weymouth St
- 1701 Marylestone Dr
- 1615 Peterson St
- 7799 Rampart Trail
- 7943 Jordan Dr
- 1172 Julian Ct
- 1092 Dartmouth Ln Unit 12
- 1084 Dartmouth Ln
- 1093 Dartmouth Ln
- 1101 Dartmouth Ln Unit 36
- 7000 Wellesley Blvd
- 1085 Dartmouth Ln Unit 34
- 6966 Wellesley Blvd
- 1076 Dartmouth Ln
- 1076 Dartmouth Ln
- 1077 Dartmouth Ln
- 6932 Wellesley Blvd Unit 3
- 1068 Dartmouth Ln
- 1128 S Hospital Rd Unit Bldg-Unit
- 1128 S Hospital Rd
- 1069 Dartmouth Ln
- 1102 Princeton Dr
- 6898 Wellesley Blvd
- 1094 Princeton Dr Unit 38
- 6970 Palos Verdes Ln Unit 1
- 1086 Princeton Dr