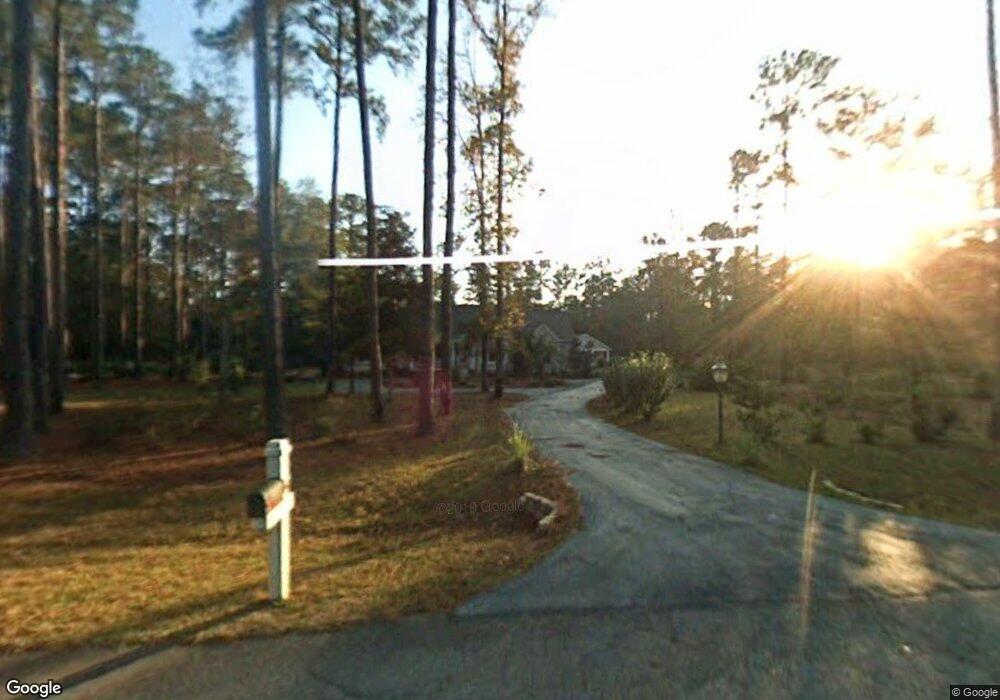
1100 Fair Hope Dr NE Townsend, GA 31331
Estimated Value: $540,367 - $672,000
3
Beds
3
Baths
2,298
Sq Ft
$263/Sq Ft
Est. Value
About This Home
This home is located at 1100 Fair Hope Dr NE, Townsend, GA 31331 and is currently estimated at $605,342, approximately $263 per square foot. 1100 Fair Hope Dr NE is a home located in McIntosh County with nearby schools including Todd Grant Elementary School, McIntosh County Middle School, and McIntosh County Academy.
Ownership History
Date
Name
Owned For
Owner Type
Purchase Details
Closed on
Feb 15, 2013
Sold by
Federal Home Loan Mortgage Corporation
Bought by
Anderson Guy W
Current Estimated Value
Home Financials for this Owner
Home Financials are based on the most recent Mortgage that was taken out on this home.
Original Mortgage
$152,000
Outstanding Balance
$106,207
Interest Rate
3.4%
Mortgage Type
New Conventional
Estimated Equity
$499,135
Purchase Details
Closed on
Aug 7, 2012
Sold by
Citimortgage Inc
Bought by
Federal Home Loan Mortgage Corporation
Purchase Details
Closed on
Apr 12, 2005
Sold by
Christman Donald W
Bought by
Mcgrath Alan L
Home Financials for this Owner
Home Financials are based on the most recent Mortgage that was taken out on this home.
Original Mortgage
$100,000
Interest Rate
5.88%
Mortgage Type
New Conventional
Purchase Details
Closed on
Dec 16, 1998
Sold by
Belvedere Isl Dev Co
Bought by
Christman Donald and Christman I
Create a Home Valuation Report for This Property
The Home Valuation Report is an in-depth analysis detailing your home's value as well as a comparison with similar homes in the area
Home Values in the Area
Average Home Value in this Area
Purchase History
| Date | Buyer | Sale Price | Title Company |
|---|---|---|---|
| Anderson Guy W | $190,000 | -- | |
| Federal Home Loan Mortgage Corporation | -- | -- | |
| Citimortgage Inc | $308,368 | -- | |
| Mcgrath Alan L | $375,000 | -- | |
| Christman Donald | $29,000 | -- |
Source: Public Records
Mortgage History
| Date | Status | Borrower | Loan Amount |
|---|---|---|---|
| Open | Anderson Guy W | $152,000 | |
| Previous Owner | Mcgrath Alan L | $100,000 |
Source: Public Records
Tax History Compared to Growth
Tax History
| Year | Tax Paid | Tax Assessment Tax Assessment Total Assessment is a certain percentage of the fair market value that is determined by local assessors to be the total taxable value of land and additions on the property. | Land | Improvement |
|---|---|---|---|---|
| 2024 | $3,976 | $203,640 | $32,000 | $171,640 |
| 2023 | $3,963 | $195,840 | $29,000 | $166,840 |
| 2022 | $3,820 | $168,600 | $29,000 | $139,600 |
| 2021 | $3,376 | $127,040 | $13,000 | $114,040 |
| 2020 | $3,544 | $123,400 | $13,000 | $110,400 |
| 2019 | $3,753 | $137,480 | $13,000 | $124,480 |
| 2018 | $3,207 | $120,680 | $25,000 | $95,680 |
| 2017 | $3,612 | $120,680 | $25,000 | $95,680 |
| 2016 | $2,739 | $120,680 | $25,000 | $95,680 |
| 2015 | $3,187 | $116,884 | $25,000 | $91,884 |
| 2014 | $2,725 | $116,884 | $25,000 | $91,884 |
Source: Public Records
Map
Nearby Homes
- 1121 Fair Hope Dr NE
- 1 Belvedere Dr
- Lot #151 Winterberry Ln NE
- 1186 Winterberry Ct NE
- 2416 Belvedere Dr NE
- 1140 Winterberry Dr
- 137 Sapelo Cir
- Lot 1 Belvedere Dr
- Lot 171 Winterberry Dr NE
- Lot 125 Sapelo Cir
- Lot 233 Refuge Way NE
- 1187 Sapelo Cir NE
- 1059 Refuge Point NE
- 0 Sapelo Cir Unit 1657610
- 0 Sapelo Cir Unit SA342517
- 132 Sapelo Cir NE
- 135 Blackbeard Ct
- 1232 Riverpoint Ln NE
- Lot 213 Riverpoint Dr NE
- 24 Settlers Cove NE
- 1100 Fair Hope Dr NE
- lot 62 Fair Hope Dr
- 1121 Fair Hope Dr NE Unit 60
- 1164 Fair Hope Dr NE
- 1018 Fair Hope Dr NE
- 1191 Fair Hope Dr NE
- 1163 Fair Hope Dr NE
- 0 Fair Hope Dr NE Unit 8501187
- 0 Fair Hope Dr NE Unit Lot 72 8968852
- 0 Fair Hope Dr NE Unit 8913831
- 62 Fair Hope Dr NE
- 12 Fair Hope Dr NE
- LOT 17 Fair Hope Dr NE
- 0 Fair Hope Dr NE
- 1163 Fair Hope Dr NE
- 22 Fair Hope Dr
- 1043 Fair Hope Dr NE
- 85 Belvedere Dr
- 85 Belvedere Dr Unit 85
- 84 Belvedere Dr Unit Lot 84