Estimated Value: $277,000 - $314,000
4
Beds
3
Baths
2,126
Sq Ft
$137/Sq Ft
Est. Value
About This Home
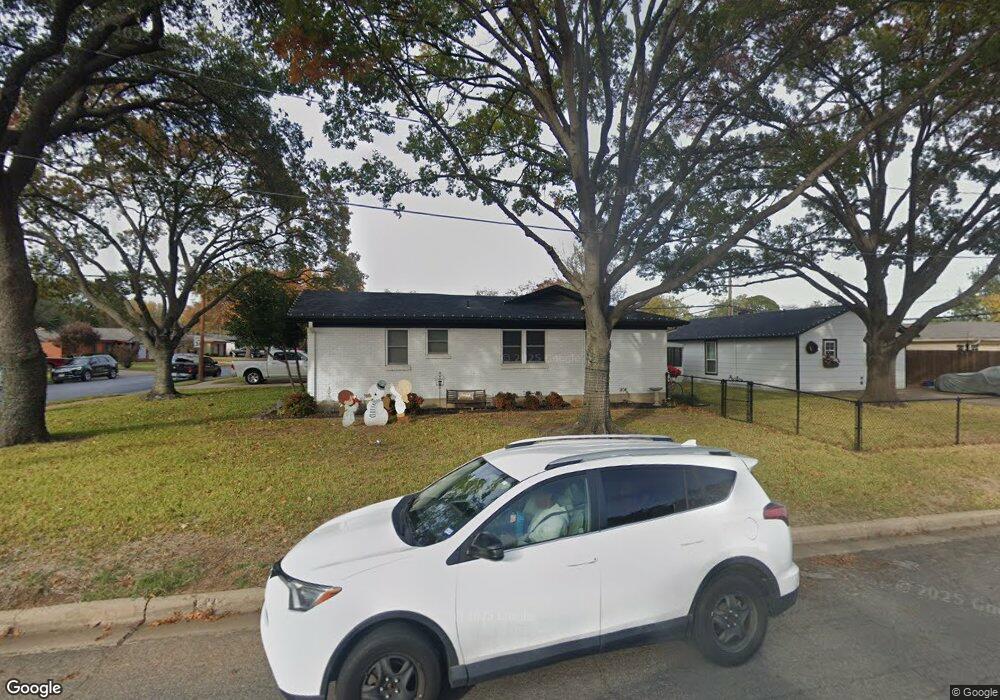
This home is located at 1100 Harrison Ln, Hurst, TX 76053 and is currently estimated at $290,293, approximately $136 per square foot. 1100 Harrison Ln is a home located in Tarrant County with nearby schools including Harrison Lane Elementary School, Hurst J High School, and L.D. Bell High School.
Ownership History
Date
Name
Owned For
Owner Type
Purchase Details
Closed on
Feb 14, 2012
Sold by
Patterson Dakota T
Bought by
Hooker Rodney P
Current Estimated Value
Home Financials for this Owner
Home Financials are based on the most recent Mortgage that was taken out on this home.
Original Mortgage
$111,110
Outstanding Balance
$77,957
Interest Rate
4.4%
Mortgage Type
FHA
Estimated Equity
$212,336
Purchase Details
Closed on
Jun 12, 2002
Sold by
Eisemann Robert R
Bought by
Patterson Dakota T
Home Financials for this Owner
Home Financials are based on the most recent Mortgage that was taken out on this home.
Original Mortgage
$106,778
Interest Rate
6.82%
Mortgage Type
FHA
Purchase Details
Closed on
Jan 15, 1997
Sold by
North Ridge Estates Joint Venture
Bought by
Eisenmann Robert R and Eisenmann Kandy J
Home Financials for this Owner
Home Financials are based on the most recent Mortgage that was taken out on this home.
Original Mortgage
$28,475
Interest Rate
7.57%
Create a Home Valuation Report for This Property
The Home Valuation Report is an in-depth analysis detailing your home's value as well as a comparison with similar homes in the area
Home Values in the Area
Average Home Value in this Area
Purchase History
| Date | Buyer | Sale Price | Title Company |
|---|---|---|---|
| Hooker Rodney P | $114,000 | Lawyers Title | |
| Patterson Dakota T | -- | American Title Co | |
| Eisenmann Robert R | -- | First American Title Co |
Source: Public Records
Mortgage History
| Date | Status | Borrower | Loan Amount |
|---|---|---|---|
| Open | Hooker Rodney P | $111,110 | |
| Previous Owner | Patterson Dakota T | $106,778 | |
| Previous Owner | Eisenmann Robert R | $28,475 |
Source: Public Records
Tax History Compared to Growth
Tax History
| Year | Tax Paid | Tax Assessment Tax Assessment Total Assessment is a certain percentage of the fair market value that is determined by local assessors to be the total taxable value of land and additions on the property. | Land | Improvement |
|---|---|---|---|---|
| 2025 | $2,209 | $204,447 | $55,000 | $149,447 |
| 2024 | $2,209 | $239,315 | $55,000 | $184,315 |
| 2023 | $4,724 | $235,797 | $40,000 | $195,797 |
| 2022 | $5,106 | $236,130 | $40,000 | $196,130 |
| 2021 | $4,862 | $227,095 | $40,000 | $187,095 |
| 2020 | $4,409 | $183,262 | $40,000 | $143,262 |
| 2019 | $4,103 | $184,614 | $40,000 | $144,614 |
| 2018 | $3,171 | $152,400 | $19,000 | $133,400 |
| 2017 | $3,506 | $183,307 | $19,000 | $164,307 |
| 2016 | $3,187 | $172,478 | $19,000 | $153,478 |
| 2015 | $2,589 | $114,500 | $15,000 | $99,500 |
| 2014 | $2,589 | $114,500 | $15,000 | $99,500 |
Source: Public Records
Map
Nearby Homes
- 1136 Simpson Dr
- 1016 Keith Dr
- 905 Brown Trail
- 420 Bedford Ct W
- 409 Vicki Place
- 400 Joanna Dr
- 1220 Norwood Dr
- 127 W Cedar St
- 802 Brown Trail
- 803 Glenda Dr
- 1208 Karla Dr
- 624 Harrison Ln
- 341 Hurst Dr
- 344 Bedford Ct E
- 644 Caduceus Ln
- 1337 Harrison Ln
- 231 Elm St
- 116 Oakhurst Dr
- 1348 Norwood Dr
- 552 Norwood Dr
- 1104 Harrison Ln
- 1101 Simpson Dr
- 1105 Simpson Dr
- 125 W Cheryl Ave
- 1108 Harrison Ln
- 121 W Cheryl Ave
- 1101 Harrison Ln
- 1105 Harrison Ln
- 117 W Cheryl Ave
- 1109 Simpson Dr
- 201 W Cheryl Ave
- 1109 Harrison Ln
- 1112 Harrison Ln
- 113 W Cheryl Ave
- 205 W Cheryl Ave
- 1113 Harrison Ln
- 1113 Simpson Dr
- 1100 Mason Dr
- 1100 Simpson Dr
- 1104 Mason Dr