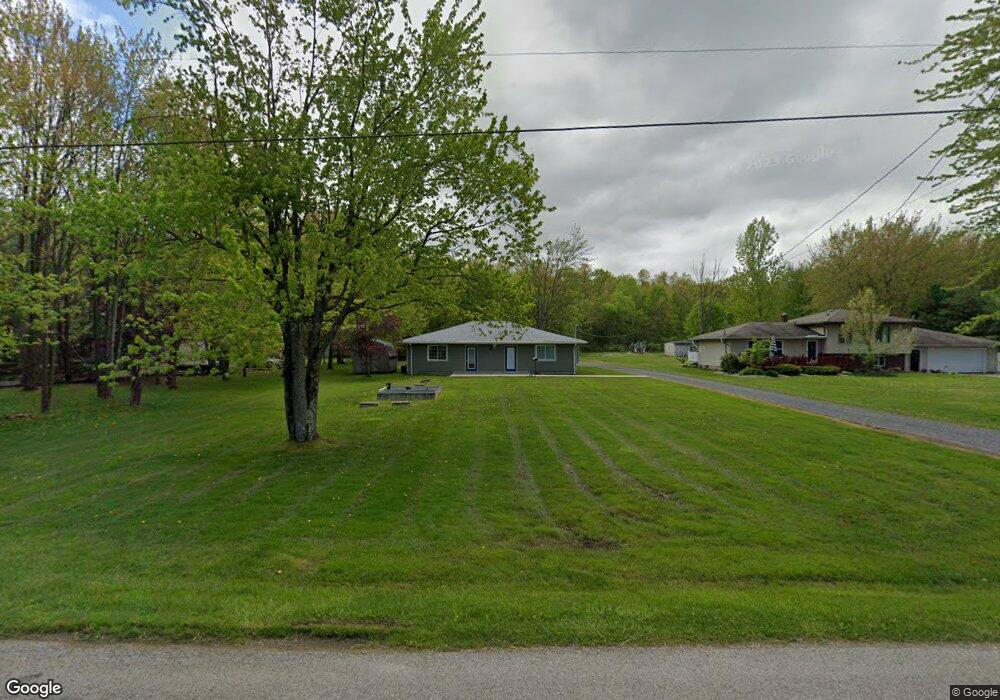
1100 Housel Craft Rd Cortland, OH 44410
Estimated Value: $152,000 - $193,000
2
Beds
2
Baths
1,496
Sq Ft
$114/Sq Ft
Est. Value
About This Home
This home is located at 1100 Housel Craft Rd, Cortland, OH 44410 and is currently estimated at $170,384, approximately $113 per square foot. 1100 Housel Craft Rd is a home located in Trumbull County with nearby schools including Maplewood Middle School, Maplewood Elementary School, and Maplewood High School.
Ownership History
Date
Name
Owned For
Owner Type
Purchase Details
Closed on
Jun 18, 2019
Sold by
Levine Timothy and Swartz Levine Jennifer
Bought by
Levine Timothy B and Swartz Levine Jennifer A
Current Estimated Value
Purchase Details
Closed on
Aug 14, 2017
Sold by
Fannie Mae
Bought by
Levine Timothy and Swartz Levine Jennifer
Purchase Details
Closed on
Apr 25, 2017
Sold by
Hufford Paul M
Bought by
Federal National Mortgage Association
Purchase Details
Closed on
Jan 26, 2017
Sold by
Hufford Paul M
Bought by
Federal National Mortgage Association
Purchase Details
Closed on
Nov 23, 2005
Sold by
Neff Tammy J
Bought by
Hufford Paul M and Hufford Nichole Tonina
Purchase Details
Closed on
Nov 19, 1996
Sold by
Fisher Cynthia M
Bought by
Salmons Tammy J
Purchase Details
Closed on
Jan 1, 1990
Bought by
Cindy Fisher
Create a Home Valuation Report for This Property
The Home Valuation Report is an in-depth analysis detailing your home's value as well as a comparison with similar homes in the area
Home Values in the Area
Average Home Value in this Area
Purchase History
| Date | Buyer | Sale Price | Title Company |
|---|---|---|---|
| Levine Timothy B | -- | None Available | |
| Levine Timothy | -- | Ohio Title Corporation | |
| Federal National Mortgage Association | $40,000 | None Available | |
| Federal National Mortgage Association | $40,000 | None Available | |
| Hufford Paul M | $82,000 | -- | |
| Hufford Paul M | $82,000 | -- | |
| Salmons Tammy J | $69,900 | -- | |
| Cindy Fisher | -- | -- |
Source: Public Records
Tax History Compared to Growth
Tax History
| Year | Tax Paid | Tax Assessment Tax Assessment Total Assessment is a certain percentage of the fair market value that is determined by local assessors to be the total taxable value of land and additions on the property. | Land | Improvement |
|---|---|---|---|---|
| 2024 | $1,794 | $45,440 | $5,710 | $39,730 |
| 2023 | $1,794 | $45,440 | $5,710 | $39,730 |
| 2022 | $1,620 | $36,480 | $5,290 | $31,190 |
| 2021 | $433 | $9,250 | $5,290 | $3,960 |
| 2020 | $432 | $9,420 | $5,290 | $4,130 |
| 2019 | $416 | $8,650 | $4,900 | $3,750 |
| 2018 | $425 | $8,890 | $4,900 | $3,990 |
| 2017 | $1,022 | $21,700 | $4,900 | $16,800 |
| 2016 | $1,182 | $25,210 | $4,520 | $20,690 |
| 2015 | $1,147 | $25,210 | $4,520 | $20,690 |
| 2014 | $1,143 | $25,210 | $4,520 | $20,690 |
| 2013 | $1,172 | $25,210 | $4,520 | $20,690 |
Source: Public Records
Map
Nearby Homes
- 5294 Cottage Dr
- 5634 N Park Ave
- 634 Bristol Champion Townline Rd NE
- 4220 N Park Ave
- 475 Greenville Rd NW
- 2684 Griffith Dr
- 3571 Hoagland Blackstub Rd
- 101 Elizabeth Ct
- 398 Bristol Champion Townline Rd NW
- 0 N High St
- 0 Shaffer Rd NW
- 167 S Mecca St
- 400 Tournament Trail Unit 400
- 3490 Durst Clagg Rd
- 507 Tournament Trail
- 288 Bristol Champion NE
- 722 Airport Rd NW
- 2693 Mahan Denman Rd NW
- 121 Fairway Dr
- 428 Cherry Hill Ln
- 1098 Housel Craft Rd
- 1074 Housel Craft Rd
- 1090 Housel Craft Rd
- 1059 Housel Craft Rd
- 1044 Housel Craft Rd
- 1144 Housel Craft Rd
- 1141 Housel Craft Rd
- 1089 Housel Craft Rd
- 1005 Housel Craft Rd
- 1182 Housel Craft Rd
- 1167 Housel Craft Rd
- 5225 Hoagland Blackstub Rd
- 5225 Hoagland Blackstub Rd
- 1202 Housel Craft Rd
- 1211 Housel Craft Rd
- 1219 Housel Craft Rd
- 967 Housel Craft Rd
- 5325 Hoagland Blackstub Rd
- 5221 Hoagland Blackstub Rd
- 0 Hoagland Blackstub Rd Unit 3637228