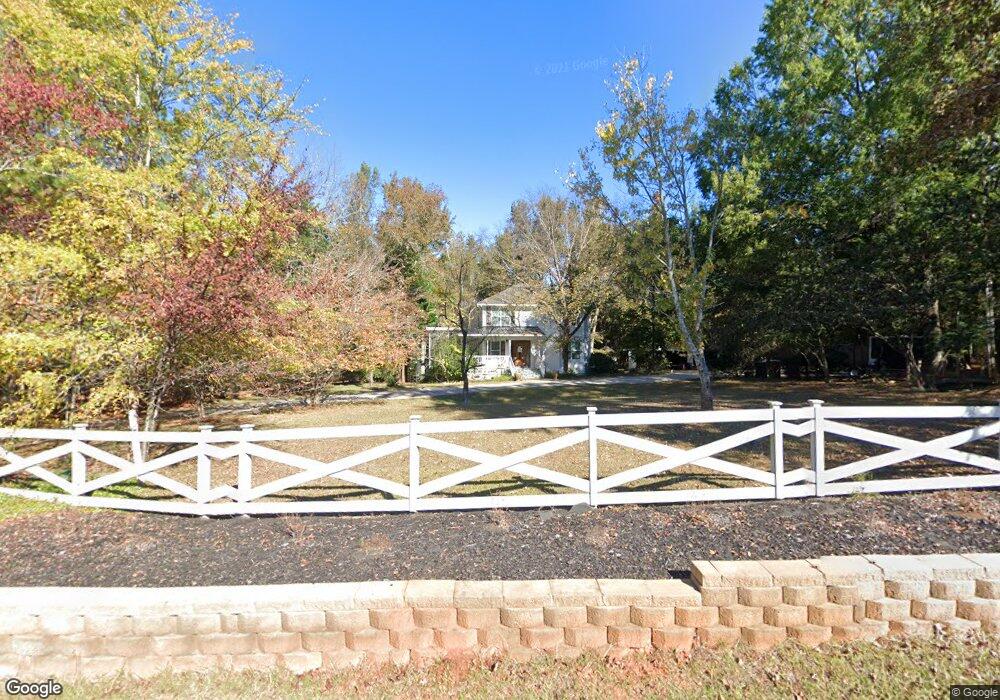
1100 Indian Fork Rd Chapin, SC 29036
Estimated Value: $341,000 - $415,000
4
Beds
3
Baths
2,286
Sq Ft
$166/Sq Ft
Est. Value
About This Home
This home is located at 1100 Indian Fork Rd, Chapin, SC 29036 and is currently estimated at $380,016, approximately $166 per square foot. 1100 Indian Fork Rd is a home located in Lexington County with nearby schools including Lake Murray Elementary School, Chapin Intermediate, and Chapin High School.
Ownership History
Date
Name
Owned For
Owner Type
Purchase Details
Closed on
Jun 20, 2019
Sold by
Saber Matrix Group Inc
Bought by
Cooper Garcia Hannah Eve and Garcia Roblero Jose Heber
Current Estimated Value
Home Financials for this Owner
Home Financials are based on the most recent Mortgage that was taken out on this home.
Original Mortgage
$217,895
Outstanding Balance
$189,925
Interest Rate
3.68%
Mortgage Type
FHA
Estimated Equity
$190,091
Purchase Details
Closed on
May 9, 2014
Sold by
Estate Of Sue R Madden and Madden James Bryan
Bought by
Saber Matrix Group Inc
Purchase Details
Closed on
Sep 22, 2010
Sold by
Estate Of Herman Eugene Madden and Madden Sue R
Bought by
Madden Sue R
Purchase Details
Closed on
Mar 20, 2006
Sold by
Rast Ernest Frederick
Bought by
Rast Ernest Frederick and Rast Rhonda S
Purchase Details
Closed on
Nov 18, 1999
Sold by
Bickley Steven B
Bought by
Madden Herman E
Create a Home Valuation Report for This Property
The Home Valuation Report is an in-depth analysis detailing your home's value as well as a comparison with similar homes in the area
Home Values in the Area
Average Home Value in this Area
Purchase History
| Date | Buyer | Sale Price | Title Company |
|---|---|---|---|
| Cooper Garcia Hannah Eve | $221,916 | None Available | |
| Saber Matrix Group Inc | $182,500 | -- | |
| Madden Sue R | -- | -- | |
| Rast Ernest Frederick | -- | None Available | |
| Madden Herman E | $104,000 | -- |
Source: Public Records
Mortgage History
| Date | Status | Borrower | Loan Amount |
|---|---|---|---|
| Open | Cooper Garcia Hannah Eve | $217,895 |
Source: Public Records
Tax History Compared to Growth
Tax History
| Year | Tax Paid | Tax Assessment Tax Assessment Total Assessment is a certain percentage of the fair market value that is determined by local assessors to be the total taxable value of land and additions on the property. | Land | Improvement |
|---|---|---|---|---|
| 2024 | $1,359 | $8,877 | $2,380 | $6,497 |
| 2023 | $1,359 | $8,877 | $2,380 | $6,497 |
| 2022 | $1,371 | $8,877 | $2,380 | $6,497 |
| 2020 | $1,436 | $8,877 | $2,380 | $6,497 |
| 2019 | $2,300 | $9,665 | $2,652 | $7,013 |
| 2018 | $4,523 | $10,950 | $2,652 | $8,298 |
| 2017 | $4,487 | $10,950 | $2,652 | $8,298 |
| 2016 | $4,455 | $10,949 | $2,652 | $8,297 |
| 2014 | $819 | $5,692 | $1,564 | $4,128 |
| 2013 | -- | $5,690 | $1,560 | $4,130 |
Source: Public Records
Map
Nearby Homes
- 2544 Wessinger Rd
- 2515 Wessinger Rd
- 129 Forest Bickley Rd
- 419 Dolomite Ct
- 622 Autumn Shiloh Dr
- 342 Chapin Place Way
- 634 Basalt Ct
- 373 Chapin Place Way
- 444 Dolomite Ct
- 515 Pine Log Run
- The Bancroft Plan at Chapin Place
- 1216 Cypress Valley Dr
- 308 Grannys Cut Way
- 630 Basalt Ct
- 605 Falling Leaf Ln
- 3010 Chilmark Rd
- 609 Falling Leaf Ln
- 302 Rising Stream Way
- 403 Rising Stream Way
- 311 Rising Stream Way
- 1101 Indian Fork Rd
- 1060 Indian Fork Rd
- 1063 Indian Fork Rd
- 1054 Indian Fork Rd
- 1126 Indian Fork Rd
- 1115 Indian Fork Rd
- 1055 Indian Fork Rd
- 1130 Indian Fork Rd
- 1125 Indian Fork Rd
- 1044 Indian Fork Rd
- 2615 Wessinger Rd
- 1134 Indian Fork Rd
- 2611 Wessinger Rd
- 1138 Indian Fork Rd
- 1061 Eau Claire Dr
- 1045 Indian Fork Rd
- 2697 Wessinger Rd
- 2705 Wessinger Rd
- 1022 Indian Fork Rd
- 1022 Indian Fork Rd