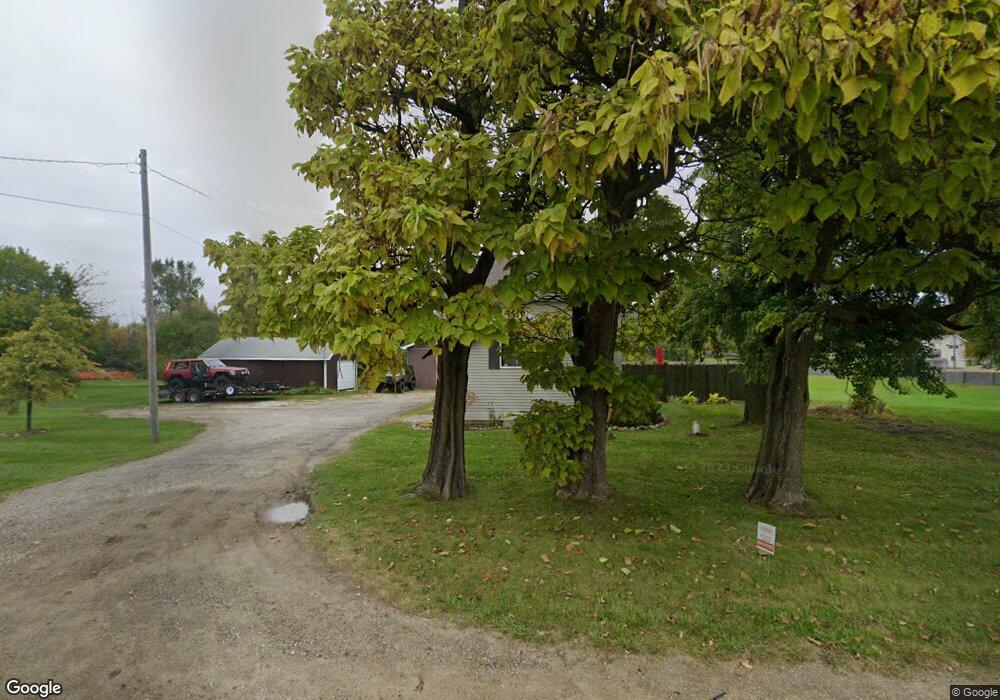
1100 Lawrence Hwy Charlotte, MI 48813
Estimated Value: $201,922 - $243,000
3
Beds
2
Baths
1,580
Sq Ft
$136/Sq Ft
Est. Value
About This Home
This home is located at 1100 Lawrence Hwy, Charlotte, MI 48813 and is currently estimated at $214,981, approximately $136 per square foot. 1100 Lawrence Hwy is a home located in Eaton County with nearby schools including Washington Elementary School, Charlotte Upper Elementary School, and Charlotte Middle School.
Ownership History
Date
Name
Owned For
Owner Type
Purchase Details
Closed on
Dec 9, 2021
Sold by
Sommer Andrew P
Bought by
Sommer Andrew and Sommer Gabrielle
Current Estimated Value
Home Financials for this Owner
Home Financials are based on the most recent Mortgage that was taken out on this home.
Original Mortgage
$138,380
Outstanding Balance
$127,273
Interest Rate
3.11%
Mortgage Type
FHA
Estimated Equity
$87,708
Purchase Details
Closed on
Oct 13, 2014
Sold by
Sommer Angela D
Bought by
Sommer Andrew P
Purchase Details
Closed on
Oct 2, 2008
Sold by
Schroeder Todd and Schroeder Danielle R
Bought by
Sommer Andrew
Home Financials for this Owner
Home Financials are based on the most recent Mortgage that was taken out on this home.
Original Mortgage
$100,610
Interest Rate
6.43%
Mortgage Type
Purchase Money Mortgage
Purchase Details
Closed on
Dec 4, 2004
Sold by
Schroeder Timothy Lee and Schroeder Jane Fay
Bought by
Schroeder Todd
Create a Home Valuation Report for This Property
The Home Valuation Report is an in-depth analysis detailing your home's value as well as a comparison with similar homes in the area
Home Values in the Area
Average Home Value in this Area
Purchase History
| Date | Buyer | Sale Price | Title Company |
|---|---|---|---|
| Sommer Andrew | -- | None Listed On Document | |
| Sommer Andrew P | -- | None Available | |
| Sommer Andrew | $98,500 | Parks Title | |
| Schroeder Todd | -- | -- |
Source: Public Records
Mortgage History
| Date | Status | Borrower | Loan Amount |
|---|---|---|---|
| Open | Sommer Andrew | $138,380 | |
| Previous Owner | Sommer Andrew | $100,610 |
Source: Public Records
Tax History Compared to Growth
Tax History
| Year | Tax Paid | Tax Assessment Tax Assessment Total Assessment is a certain percentage of the fair market value that is determined by local assessors to be the total taxable value of land and additions on the property. | Land | Improvement |
|---|---|---|---|---|
| 2025 | $2,860 | $66,600 | $0 | $0 |
| 2024 | $1,693 | $65,100 | $0 | $0 |
| 2023 | $1,594 | $59,800 | $0 | $0 |
| 2022 | $2,149 | $54,800 | $0 | $0 |
| 2021 | $2,059 | $51,400 | $0 | $0 |
| 2020 | $1,875 | $49,100 | $0 | $0 |
| 2019 | $1,844 | $44,954 | $0 | $0 |
| 2018 | $1,806 | $42,679 | $0 | $0 |
| 2017 | $1,747 | $40,624 | $0 | $0 |
| 2016 | -- | $40,757 | $0 | $0 |
| 2015 | -- | $39,758 | $0 | $0 |
| 2014 | -- | $38,582 | $0 | $0 |
| 2013 | -- | $38,237 | $0 | $0 |
Source: Public Records
Map
Nearby Homes
- 1272 W Lawrence Hwy
- 717 Katies Way
- 525 N Wheaton Rd
- 113 S Clinton St
- 717 High St
- 827 Walnut St
- 206 W Harris St
- 308 S Sheldon St
- 738 W Shepherd St
- 757 W Shepherd St
- 315 W Henry St
- 0 Pinebluff Dr Parcel O Unit 258041
- 318 N Cochran Ave
- 428 N Washington St
- 922 High St
- 340 Horatio St
- 601 S Cochran Ave
- 335 Pleasant St
- 509 W 3rd St
- 208 W 1st St
- 1050 W Lawrence Ave
- 1050 Lawrence Hwy
- 1050 W Lawrence Hwy
- 1120 Lawrence Hwy
- 1120 Lawrence Hwy
- 0 N Wheaton Rd
- 1101 Lawrence Hwy
- 911 Foote St
- 911 Foote St
- 913 W Lawrence Ave
- 821 Foote St
- 901 Foote St
- 914 Foote St
- 1110 Lawrence Hwy
- 1110 Lawrence Hwy
- 47 N Wheaton Rd
- 47 N Wheaton Rd Unit R5
- 905 W Lawrence Ave
- 901 W Lawrence Ave
- 50 N Wheaton Rd