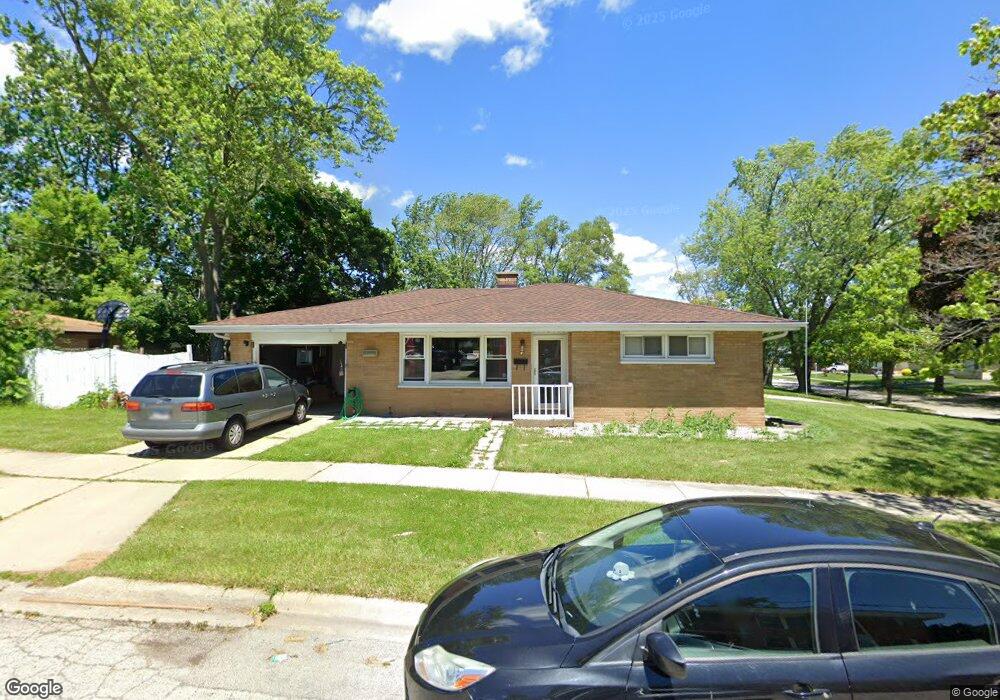
1100 Longview Rd Waukegan, IL 60087
Marquette Highlands NeighborhoodEstimated Value: $245,000 - $253,000
3
Beds
2
Baths
1,045
Sq Ft
$238/Sq Ft
Est. Value
About This Home
This home is located at 1100 Longview Rd, Waukegan, IL 60087 and is currently estimated at $248,722, approximately $238 per square foot. 1100 Longview Rd is a home located in Lake County with nearby schools including John S. Clark Elementary School, Jack Benny Middle School, and Waukegan High School.
Ownership History
Date
Name
Owned For
Owner Type
Purchase Details
Closed on
Apr 10, 2024
Sold by
Robey Thelonius B
Bought by
Thelonius B Robey Living Trust and Robey
Current Estimated Value
Purchase Details
Closed on
Jul 31, 2015
Sold by
Timberstone Property Solutions Llc
Bought by
Robey Thelonious B
Home Financials for this Owner
Home Financials are based on the most recent Mortgage that was taken out on this home.
Original Mortgage
$125,190
Interest Rate
4.37%
Mortgage Type
FHA
Purchase Details
Closed on
Mar 16, 2011
Sold by
Raines
Bought by
The Secretary Of Housing & Urban Develop
Purchase Details
Closed on
Mar 18, 2005
Sold by
Mendez Danira M and Rumaneh Danira M
Bought by
Raines Sheila D
Home Financials for this Owner
Home Financials are based on the most recent Mortgage that was taken out on this home.
Original Mortgage
$161,182
Interest Rate
5.71%
Mortgage Type
FHA
Purchase Details
Closed on
Oct 17, 1994
Sold by
Lopez Jose Manuel and Mendez Danira M
Bought by
Mendez Danira M
Create a Home Valuation Report for This Property
The Home Valuation Report is an in-depth analysis detailing your home's value as well as a comparison with similar homes in the area
Home Values in the Area
Average Home Value in this Area
Purchase History
| Date | Buyer | Sale Price | Title Company |
|---|---|---|---|
| Thelonius B Robey Living Trust | -- | None Listed On Document | |
| Robey Thelonious B | $127,500 | Fidelity National Title | |
| The Secretary Of Housing & Urban Develop | -- | None Available | |
| Raines Sheila D | $163,500 | -- | |
| Mendez Danira M | -- | -- |
Source: Public Records
Mortgage History
| Date | Status | Borrower | Loan Amount |
|---|---|---|---|
| Previous Owner | Robey Thelonious B | $125,190 | |
| Previous Owner | Raines Sheila D | $161,182 |
Source: Public Records
Tax History Compared to Growth
Tax History
| Year | Tax Paid | Tax Assessment Tax Assessment Total Assessment is a certain percentage of the fair market value that is determined by local assessors to be the total taxable value of land and additions on the property. | Land | Improvement |
|---|---|---|---|---|
| 2024 | $5,539 | $65,095 | $10,318 | $54,777 |
| 2023 | $5,305 | $58,739 | $9,311 | $49,428 |
| 2022 | $5,305 | $54,264 | $8,059 | $46,205 |
| 2021 | $5,077 | $48,694 | $7,189 | $41,505 |
| 2020 | $5,142 | $45,364 | $6,697 | $38,667 |
| 2019 | $5,175 | $41,569 | $6,137 | $35,432 |
| 2018 | $4,564 | $36,487 | $8,685 | $27,802 |
| 2017 | $4,285 | $30,120 | $7,684 | $22,436 |
| 2016 | $4,045 | $26,173 | $6,677 | $19,496 |
| 2015 | $3,957 | $23,425 | $5,976 | $17,449 |
| 2014 | $3,080 | $18,193 | $6,069 | $12,124 |
| 2012 | $4,707 | $24,319 | $6,576 | $17,743 |
Source: Public Records
Map
Nearby Homes
- 2232 Walnut St
- 1905 Linden Ave
- 1018 W Atlantic Ave
- 616 W Keith Ave
- 2350 N Lewis Ave
- 301 W Eagle Ct
- 0 Traditions Dr
- 1335 Chestnut St
- 1336 N Ash St
- 2613 N Lewis Ave
- 1312 N Linden Ave
- 2246 Alta Vista Dr
- 1612 Whitney St
- 2207 Williamsburg Dr
- 1504 W Glen Flora Ave
- 2008 Harding Ave
- 2213 Alta Vista Dr
- 2009 Harding Ave
- 1105 Woodlawn Cir
- 1913 Chippewa Rd
- 2104 Linden Ave
- 2108 N Linden Ave
- 2108 Linden Ave
- 1101 Longview Rd
- 1110 Longview Rd
- 2105 Western Ave
- 2112 Linden Ave
- 2109 Western Ave
- 1109 Longview Rd
- 2070 Linden Ave
- 1020 Longview Rd
- 2105 Linden Ave
- 2113 Western Ave
- 2049 Linden Ave
- 2109 Linden Ave
- 2116 Linden Ave
- 2058 Linden Ave
- 2045 Linden Ave
- 2113 Linden Ave
- 2117 Western Ave