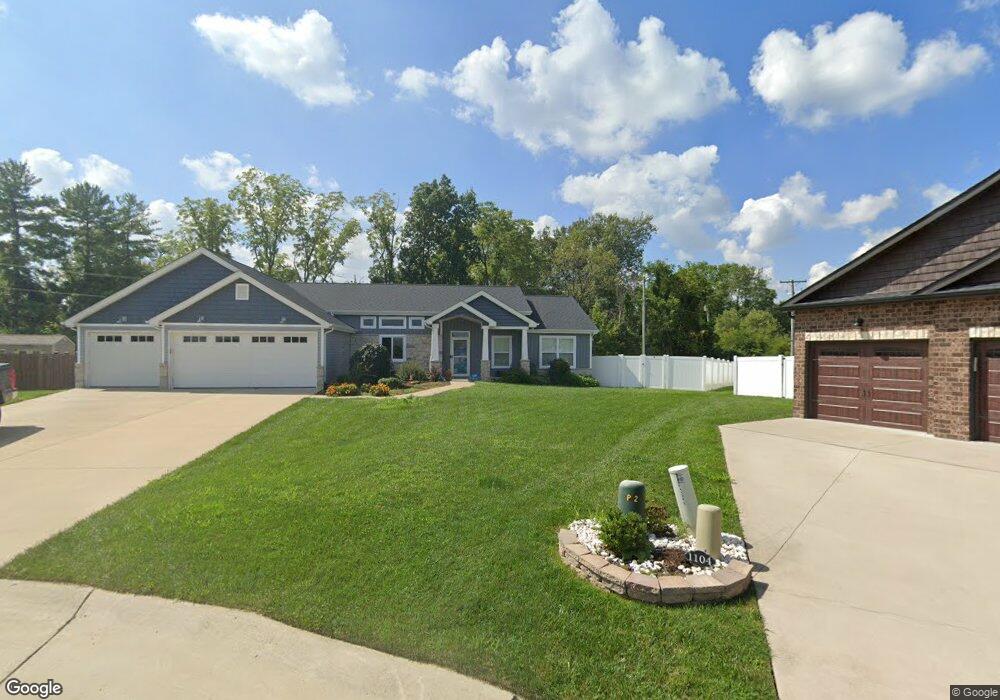
1100 Lucca Ct Caseyville, IL 62232
Estimated Value: $457,000 - $556,000
--
Bed
--
Bath
2,018
Sq Ft
$249/Sq Ft
Est. Value
About This Home
This home is located at 1100 Lucca Ct, Caseyville, IL 62232 and is currently estimated at $502,245, approximately $248 per square foot. 1100 Lucca Ct is a home located in St. Clair County with nearby schools including Schaefer Elementary School, Fulton Junior High School, and O'Fallon Township High School.
Ownership History
Date
Name
Owned For
Owner Type
Purchase Details
Closed on
Sep 27, 2018
Sold by
Jlp Homes Llc
Bought by
Wahler Michael L and Balon Wahler Vanessa M
Current Estimated Value
Home Financials for this Owner
Home Financials are based on the most recent Mortgage that was taken out on this home.
Original Mortgage
$297,219
Outstanding Balance
$261,205
Interest Rate
4.87%
Mortgage Type
New Conventional
Estimated Equity
$241,040
Purchase Details
Closed on
Jan 16, 2018
Sold by
Thedennis W Keller Trust
Bought by
Jlp Homes Llc
Home Financials for this Owner
Home Financials are based on the most recent Mortgage that was taken out on this home.
Original Mortgage
$288,000
Interest Rate
3.93%
Mortgage Type
Construction
Purchase Details
Closed on
Apr 21, 2011
Sold by
Mar Kell Group Llc
Bought by
Keller Dennis W and The Dennis W Keller Trust
Create a Home Valuation Report for This Property
The Home Valuation Report is an in-depth analysis detailing your home's value as well as a comparison with similar homes in the area
Home Values in the Area
Average Home Value in this Area
Purchase History
| Date | Buyer | Sale Price | Title Company |
|---|---|---|---|
| Wahler Michael L | $372,000 | Accent Title Inc | |
| Jlp Homes Llc | $47,500 | Accent Title Inc | |
| Keller Dennis W | $45,000 | First American Title Ins Co |
Source: Public Records
Mortgage History
| Date | Status | Borrower | Loan Amount |
|---|---|---|---|
| Open | Wahler Michael L | $297,219 | |
| Previous Owner | Jlp Homes Llc | $288,000 |
Source: Public Records
Tax History Compared to Growth
Tax History
| Year | Tax Paid | Tax Assessment Tax Assessment Total Assessment is a certain percentage of the fair market value that is determined by local assessors to be the total taxable value of land and additions on the property. | Land | Improvement |
|---|---|---|---|---|
| 2024 | -- | $140,416 | $21,356 | $119,060 |
| 2023 | -- | $124,240 | $18,896 | $105,344 |
| 2022 | $5,827 | $106,433 | $18,016 | $88,417 |
| 2021 | $7,534 | $101,018 | $17,099 | $83,919 |
| 2020 | $7,471 | $95,689 | $16,197 | $79,492 |
| 2019 | $7,298 | $95,689 | $16,197 | $79,492 |
| 2018 | $2,007 | $360 | $360 | $0 |
| 2017 | $27 | $345 | $345 | $0 |
| 2016 | $27 | $337 | $337 | $0 |
| 2014 | $26 | $349 | $349 | $0 |
| 2013 | $26 | $355 | $355 | $0 |
Source: Public Records
Map
Nearby Homes
- 1128 Pisa Dr
- 690 Vinci Dr
- 678 Prato Ct
- 124 Long Branch Ln
- 1012 Crooked Stick Dr
- 28 Geneva Dr
- 305 Forest Oaks Dr
- 363 Old Collinsville Rd
- 107 Bethel Mine Rd
- 1240 Pausch Rd Unit 6.65 ac
- 1240 Pausch Rd
- 1240 Pausch Rd Unit 39.72 ac
- 1909 Windcrest Dr
- 7751 N Illinois St
- 7745 N Illinois St
- 817 Golden Bell Ln
- 1821 Orr Ln
- 1034 Far Oaks Dr
- 609 Tea Olive Blvd
- 805 Golden Bell Ln