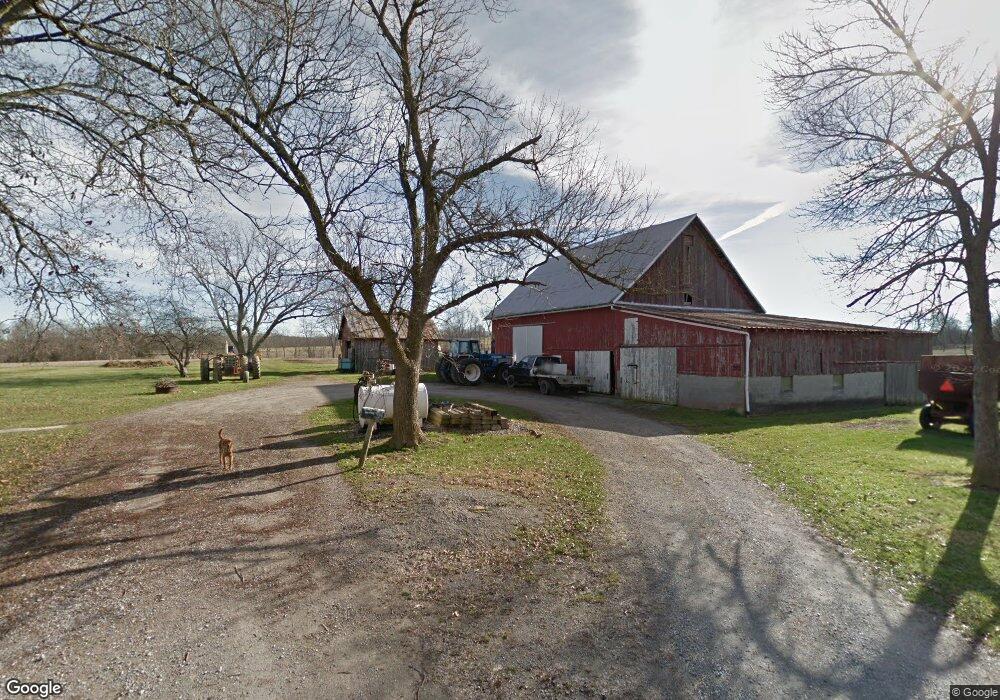
1100 Mcclure Rd Hillsboro, OH 45133
Estimated Value: $588,000 - $861,000
4
Beds
1
Bath
1,900
Sq Ft
$380/Sq Ft
Est. Value
About This Home
This home is located at 1100 Mcclure Rd, Hillsboro, OH 45133 and is currently estimated at $722,099, approximately $380 per square foot. 1100 Mcclure Rd is a home located in Highland County with nearby schools including Bright Elementary School, Whiteoak Junior High School, and Whiteoak High School.
Ownership History
Date
Name
Owned For
Owner Type
Purchase Details
Closed on
Sep 23, 2016
Sold by
Rains Elizabeth
Bought by
Cox Chris S and Mitchell Cox Mandy
Current Estimated Value
Home Financials for this Owner
Home Financials are based on the most recent Mortgage that was taken out on this home.
Original Mortgage
$48,030
Outstanding Balance
$21,629
Interest Rate
2.77%
Mortgage Type
Future Advance Clause Open End Mortgage
Estimated Equity
$700,470
Purchase Details
Closed on
May 28, 2010
Sold by
Grassan Gary G
Bought by
Cox Stan L
Home Financials for this Owner
Home Financials are based on the most recent Mortgage that was taken out on this home.
Original Mortgage
$50,000
Interest Rate
4.42%
Mortgage Type
Commercial
Purchase Details
Closed on
Mar 7, 1996
Sold by
Grassan George E
Bought by
Grassan Gary G
Purchase Details
Closed on
Jan 1, 1990
Bought by
Grassan George E and Grassan Mary E
Create a Home Valuation Report for This Property
The Home Valuation Report is an in-depth analysis detailing your home's value as well as a comparison with similar homes in the area
Home Values in the Area
Average Home Value in this Area
Purchase History
| Date | Buyer | Sale Price | Title Company |
|---|---|---|---|
| Cox Chris S | $60,100 | Attorney | |
| Cox Stan L | $325,000 | Attorney | |
| Grassan Gary G | $97,000 | -- | |
| Grassan George E | -- | -- |
Source: Public Records
Mortgage History
| Date | Status | Borrower | Loan Amount |
|---|---|---|---|
| Open | Cox Chris S | $48,030 | |
| Previous Owner | Cox Stan L | $50,000 |
Source: Public Records
Tax History Compared to Growth
Tax History
| Year | Tax Paid | Tax Assessment Tax Assessment Total Assessment is a certain percentage of the fair market value that is determined by local assessors to be the total taxable value of land and additions on the property. | Land | Improvement |
|---|---|---|---|---|
| 2024 | $3,775 | $231,700 | $196,840 | $34,860 |
| 2023 | $3,775 | $153,930 | $138,180 | $15,750 |
| 2022 | $2,067 | $153,930 | $138,180 | $15,750 |
| 2021 | $1,972 | $58,850 | $43,100 | $15,750 |
| 2020 | $2,426 | $69,780 | $56,650 | $13,130 |
| 2019 | $2,411 | $69,780 | $56,650 | $13,130 |
| 2018 | $2,421 | $69,780 | $56,650 | $13,130 |
| 2017 | $3,024 | $87,000 | $77,480 | $9,520 |
| 2016 | $3,025 | $87,000 | $77,480 | $9,520 |
| 2015 | $1,515 | $87,000 | $77,480 | $9,520 |
| 2014 | $899 | $49,600 | $40,080 | $9,520 |
| 2013 | $900 | $49,600 | $40,080 | $9,520 |
Source: Public Records
Map
Nearby Homes
- 0 Rocklick Rd Unit 1850847
- 0 Rocklick Rd Unit 22305798
- 0 Rocklick Rd Unit 1827311
- 0 Rocklick Rd Unit 11401099
- 1765 Greenbrier Rd
- 1865 Ohio 247
- 9963 Coss Rd
- 1717 Zion Ln
- 1445 Louisville Rd
- 9094 W Deadfall Rd
- 9888 E Deadfall Rd
- 635 Pence Rd
- 359 Buck Run Rd
- 870 Fenton Rd
- 11883 Walnut Shade Rd
- 4404 Louisville Rd
- AC Fenton Rd
- 968 Redkey Rd
- 530 Mount Leigh Rd
- 1721 May Hill Rd
- 1161 Mcclure Rd
- 8810 State Route 785
- 0 Locust Rd Unit 1279628
- 0 Locust Rd Unit 1603429
- 1028 Locust Rd
- 1028 Locust Rd
- 1000 Locust Rd
- 980 Locust Rd
- 1060 Locust Rd
- 1 Locust
- 8861 State Route 785
- 8721 Brannen Rd
- 8877 State Route 785
- 8861 Ohio 785
- 8671 Brannen Rd
- 8801 Brannen Rd
- 8840 Brannen Rd
- 8831 St Rt 785
- 1030 Locust Rd
- 0 Brannen Rd Unit 1767069