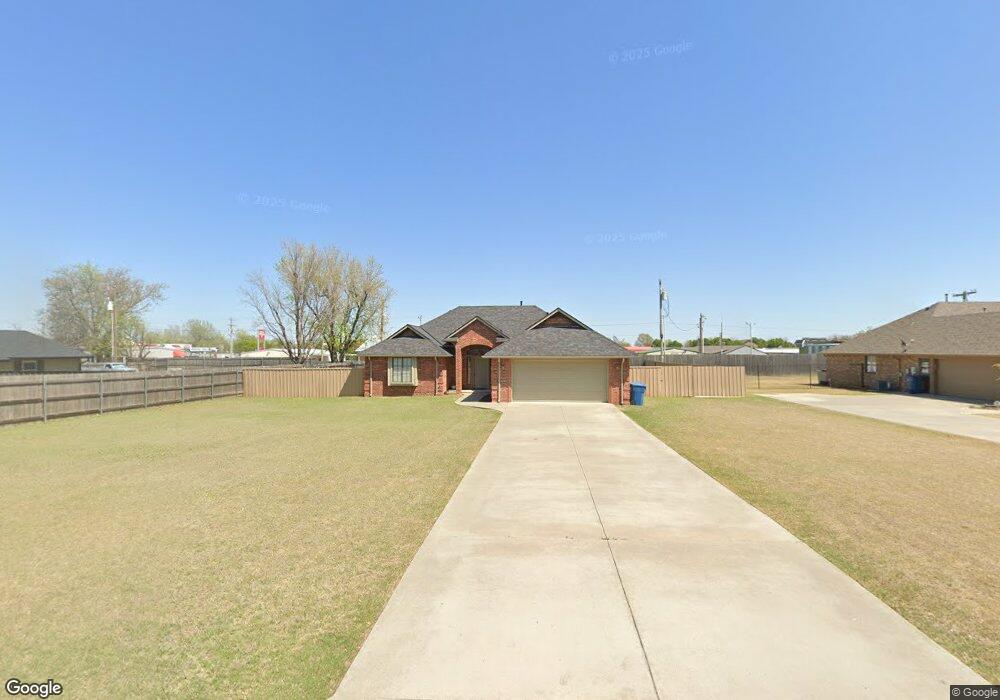
1100 N Carr Dr Newcastle, OK 73065
Estimated Value: $217,000 - $270,963
3
Beds
2
Baths
1,384
Sq Ft
$177/Sq Ft
Est. Value
About This Home
This home is located at 1100 N Carr Dr, Newcastle, OK 73065 and is currently estimated at $245,241, approximately $177 per square foot. 1100 N Carr Dr is a home with nearby schools including Newcastle Elementary School, Newcastle Middle School, and Newcastle High School.
Ownership History
Date
Name
Owned For
Owner Type
Purchase Details
Closed on
Nov 1, 2019
Sold by
Richard R Dillenbeck Revocable Living Tr
Bought by
Foote Amanda
Current Estimated Value
Purchase Details
Closed on
Dec 31, 2013
Sold by
Williams Troy Lee and Williams Sharo
Bought by
Wood Bradley W and Wood Chrissy
Purchase Details
Closed on
Jul 14, 2011
Sold by
Fireside Custom Homes L L C
Bought by
Williams Troy Lee and Williams Sharon Terese
Home Financials for this Owner
Home Financials are based on the most recent Mortgage that was taken out on this home.
Original Mortgage
$133,950
Interest Rate
4.55%
Mortgage Type
New Conventional
Purchase Details
Closed on
Jul 12, 2011
Sold by
Tortico Ventures Llc
Bought by
Fireside Custom Homes Llc
Home Financials for this Owner
Home Financials are based on the most recent Mortgage that was taken out on this home.
Original Mortgage
$133,950
Interest Rate
4.55%
Mortgage Type
New Conventional
Create a Home Valuation Report for This Property
The Home Valuation Report is an in-depth analysis detailing your home's value as well as a comparison with similar homes in the area
Home Values in the Area
Average Home Value in this Area
Purchase History
| Date | Buyer | Sale Price | Title Company |
|---|---|---|---|
| Foote Amanda | -- | None Listed On Document | |
| Wood Bradley W | $143,500 | -- | |
| Williams Troy Lee | $141,000 | Gaco | |
| Fireside Custom Homes Llc | -- | None Available |
Source: Public Records
Mortgage History
| Date | Status | Borrower | Loan Amount |
|---|---|---|---|
| Previous Owner | Williams Troy Lee | $133,950 |
Source: Public Records
Tax History Compared to Growth
Tax History
| Year | Tax Paid | Tax Assessment Tax Assessment Total Assessment is a certain percentage of the fair market value that is determined by local assessors to be the total taxable value of land and additions on the property. | Land | Improvement |
|---|---|---|---|---|
| 2025 | $2,006 | $19,054 | $2,605 | $16,449 |
| 2024 | $2,006 | $18,499 | $2,529 | $15,970 |
| 2023 | $2,006 | $17,960 | $2,455 | $15,505 |
| 2022 | $1,897 | $17,438 | $2,374 | $15,064 |
| 2021 | $1,929 | $16,929 | $2,294 | $14,635 |
| 2020 | $1,878 | $16,437 | $2,218 | $14,219 |
| 2019 | $1,847 | $15,958 | $2,143 | $13,815 |
| 2018 | $1,763 | $15,494 | $2,061 | $13,433 |
| 2017 | $1,704 | $15,042 | $2,536 | $12,506 |
| 2016 | $1,657 | $14,604 | $1,650 | $12,954 |
| 2015 | $1,851 | $16,185 | $1,650 | $14,535 |
| 2014 | $1,778 | $15,785 | $1,650 | $14,135 |
Source: Public Records
Map
Nearby Homes
- 1013 N Carr Dr
- 1100 N Doris Ave
- 1109 N Doris Ave
- 375 NE 9th Place
- 303 Naomi Ln
- 908 NW 6th St
- 820 NW 5th St
- 808 Saint James Place
- 1009 NW 5th St
- 1657 Autumn Lane Ct
- 2 S Main St
- 3 S Main St
- 1 S Main St
- 4 S Main St
- 5 S Main St
- 6 S Main St
- 1012 NW 5th St
- 1009 NW 17th St
- 1116 Vermont Ave
- 501 Saint James Place
- 1108 N Carr Dr
- 1050 N Carr Dr
- 1112 N Carr Dr
- 1010 N Carr Dr
- 1101 N Carr Dr
- 1021 N Carr Dr
- 1021 N Main St
- 1109 N Carr Dr
- 1200 N Carr Dr
- 1113 N Carr Dr
- 1006 N Carr Dr
- 1204 N Carr Dr
- 1009 N Carr Dr
- 3043 SE 34th St
- 3034 SE 34th St
- 3135 SE 34th St
- 3116 SE 35th St
- 0000 Air Park
- 1108 N Doris Ave
- 1205 N Carr Dr