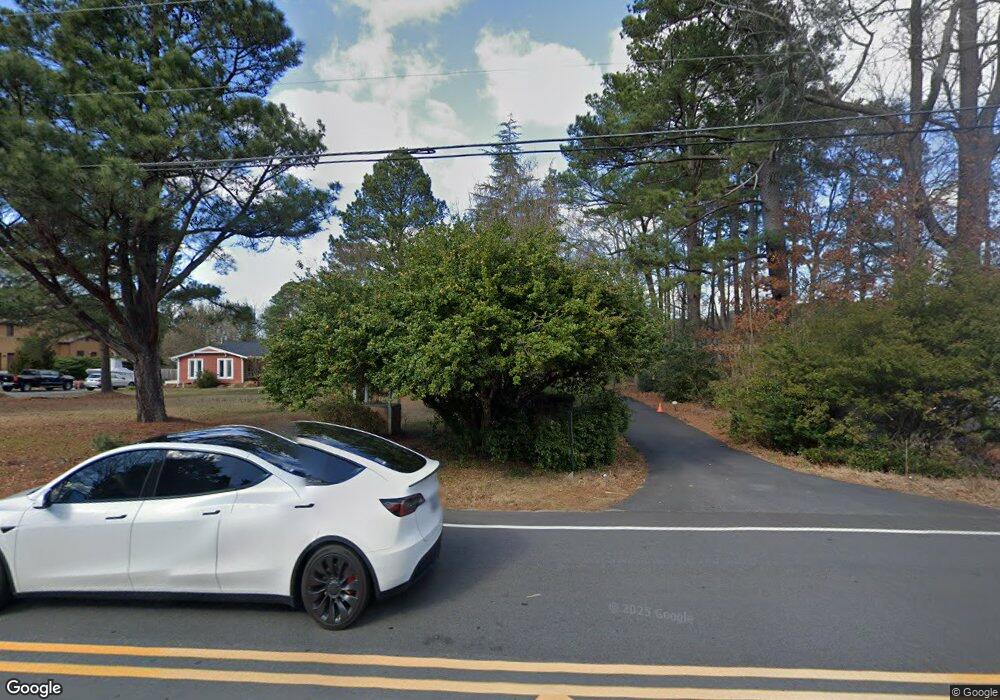
1100 Olive Chapel Rd Apex, NC 27502
Beaver Creek NeighborhoodEstimated Value: $688,000 - $881,792
4
Beds
3
Baths
2,515
Sq Ft
$319/Sq Ft
Est. Value
About This Home
This home is located at 1100 Olive Chapel Rd, Apex, NC 27502 and is currently estimated at $801,698, approximately $318 per square foot. 1100 Olive Chapel Rd is a home located in Wake County with nearby schools including Salem Elementary, Salem Middle, and Apex Friendship High School.
Ownership History
Date
Name
Owned For
Owner Type
Purchase Details
Closed on
Jul 10, 2018
Sold by
Denny Josephien M
Bought by
Pounds Mary M
Current Estimated Value
Home Financials for this Owner
Home Financials are based on the most recent Mortgage that was taken out on this home.
Original Mortgage
$453,050
Outstanding Balance
$392,635
Interest Rate
4.5%
Mortgage Type
New Conventional
Estimated Equity
$409,063
Purchase Details
Closed on
Sep 30, 1999
Sold by
Cosgrove Dena T and Cosgrove Jeffrey H
Bought by
Denny Bob S and Denny Josephine M
Home Financials for this Owner
Home Financials are based on the most recent Mortgage that was taken out on this home.
Original Mortgage
$252,700
Interest Rate
8.25%
Create a Home Valuation Report for This Property
The Home Valuation Report is an in-depth analysis detailing your home's value as well as a comparison with similar homes in the area
Home Values in the Area
Average Home Value in this Area
Purchase History
| Date | Buyer | Sale Price | Title Company |
|---|---|---|---|
| Pounds Mary M | $533,000 | None Available | |
| Denny Bob S | $317,000 | -- |
Source: Public Records
Mortgage History
| Date | Status | Borrower | Loan Amount |
|---|---|---|---|
| Open | Pounds Mary M | $453,050 | |
| Previous Owner | Denny Bob S | $252,700 |
Source: Public Records
Tax History Compared to Growth
Tax History
| Year | Tax Paid | Tax Assessment Tax Assessment Total Assessment is a certain percentage of the fair market value that is determined by local assessors to be the total taxable value of land and additions on the property. | Land | Improvement |
|---|---|---|---|---|
| 2025 | $6,916 | $789,822 | $404,000 | $385,822 |
| 2024 | $6,761 | $789,822 | $404,000 | $385,822 |
| 2023 | $5,624 | $510,886 | $237,000 | $273,886 |
| 2022 | $5,280 | $510,886 | $237,000 | $273,886 |
| 2021 | $5,078 | $510,886 | $237,000 | $273,886 |
| 2020 | $5,027 | $510,886 | $237,000 | $273,886 |
| 2019 | $4,687 | $410,892 | $198,000 | $212,892 |
| 2018 | $0 | $410,892 | $198,000 | $212,892 |
| 2017 | $4,108 | $410,892 | $198,000 | $212,892 |
| 2016 | $4,049 | $457,044 | $238,500 | $218,544 |
| 2015 | $3,785 | $374,829 | $164,000 | $210,829 |
| 2014 | $3,648 | $374,829 | $164,000 | $210,829 |
Source: Public Records
Map
Nearby Homes
- 1800 Pierre Place
- 105 Troyer Place
- 1116 Silky Dogwood Trail
- 1105 Capitata Crossing
- 2008 Silky Dogwood Trail
- 1209 Haywards Heath Ln
- 235 Eyam Hall Ln
- 232 Eyam Hall Ln
- 427 Eyam Hall Ln
- 2007 Ackerman Hill Dr
- 1038 Brownsmith Dr
- 1001 Drayman Place
- 1004 Wild Sonnet Ct
- 2112 Barrier Ridge Way Unit Lot 34
- 1110 Palisade Bluff Ln Unit Lot 5
- 2124 Barrier Ridge Way
- 1002 Tribble Gate Ct
- 2113 Barrier Ridge Way Unit Lot 26
- 2115 Barrier Ridge Way Unit Lot 25
- 2117 Barrier Ridge Way Unit Lot 24
- 1828 Grande Chateau Ln
- 1825 Grande Chateau Ln
- 1824 Grande Chateau Ln
- 1820 Grande Chateau Ln
- 1821 Grande Chateau Ln
- 1108 Olive Chapel Rd
- 1817 Grande Chateau Ln
- 1816 Grande Chateau Ln
- 1821 Grande Maison Dr
- 1813 Grande Chateau Ln
- 1110 Olive Chapel Rd
- 1817 Grande Maison Dr
- 1825 Grande Maison Dr
- 1810 Grande Chateau Ln
- 221 Kellerhis Dr
- 224 Kellerhis Dr
- 1813 Grande Maison Dr
- 1809 Grande Chateau Ln
- 1806 Grande Chateau Ln
- 1824 Grande Maison Dr