
Landlord's Agent in 2024
Amber Krause
TTR Sotheby's International Realty
(443) 783-7244
1 in this area
27 Total Sales

Estimated Value: $946,000 - $1,094,000
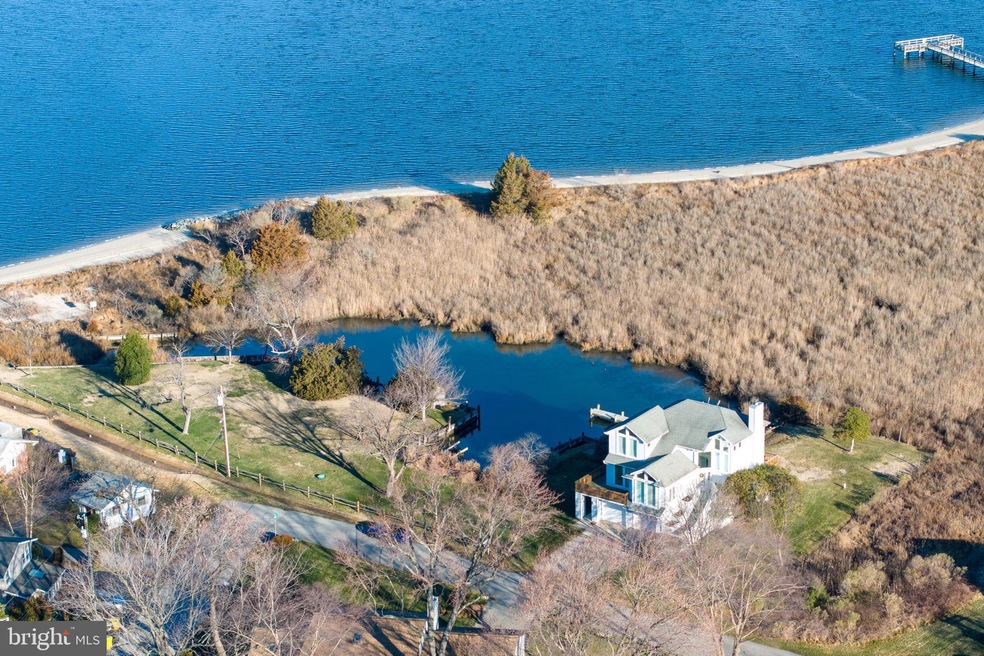
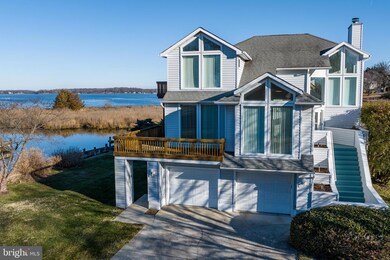
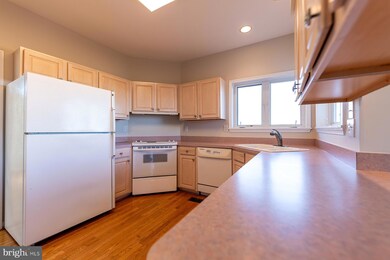
This location is serene and private. Sunset views don't get any better! Enjoy the waterfront lifestyle on Turkey Point Island. Boat slip included. (up to 40 feet)
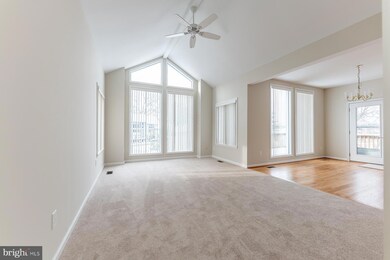
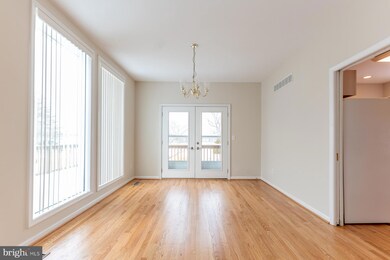
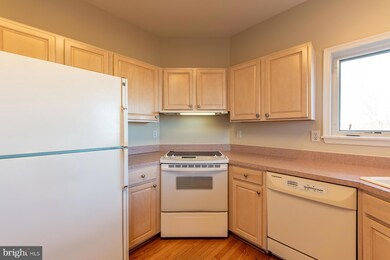
All new flooring. Freshly painted, neutral colors.
Last Agent to Rent the Property
(410) 280-5600 akrause@ttrsir.com TTR Sotheby's International Realty Listed on: 01/08/2024
Last Renter's Agent
(410) 280-5600 akrause@ttrsir.com TTR Sotheby's International Realty Listed on: 01/08/2024
| Date | Buyer | Sale Price | Title Company |
|---|---|---|---|
| 1100 Paca Llc | $940,000 | Eagle Title | |
| Szachnowicz Aleksy L | -- | -- | |
| Szachnowicz Alesky L | $449,900 | -- | |
| Anderson Mildred P | $1,200 | -- |
| Date | Status | Borrower | Loan Amount |
|---|---|---|---|
| Closed | Szachnowicz Aleksy L | -- |
| Date | Event | Price | List to Sale | Price per Sq Ft | Prior Sale |
|---|---|---|---|---|---|
| 02/17/2024 02/17/24 | Rented | $4,100 | +2.5% | -- | |
| 02/17/2024 02/17/24 | Under Contract | -- | -- | -- | |
| 02/13/2024 02/13/24 | Price Changed | $4,000 | -11.1% | $2 / Sq Ft | |
| 02/13/2024 02/13/24 | Price Changed | $4,500 | -10.0% | $2 / Sq Ft | |
| 01/08/2024 01/08/24 | For Rent | $5,000 | 0.0% | -- | |
| 12/31/2023 12/31/23 | Sold | $940,000 | -0.9% | $434 / Sq Ft | View Prior Sale |
| 08/22/2023 08/22/23 | Price Changed | $949,000 | -5.1% | $438 / Sq Ft | |
| 08/03/2023 08/03/23 | Price Changed | $999,990 | -8.3% | $461 / Sq Ft | |
| 06/22/2023 06/22/23 | Price Changed | $1,090,000 | -9.2% | $503 / Sq Ft | |
| 05/18/2023 05/18/23 | Price Changed | $1,199,900 | -7.7% | $553 / Sq Ft | |
| 05/03/2023 05/03/23 | For Sale | $1,299,900 | -- | $600 / Sq Ft |
| Year | Tax Paid | Tax Assessment Tax Assessment Total Assessment is a certain percentage of the fair market value that is determined by local assessors to be the total taxable value of land and additions on the property. | Land | Improvement |
|---|---|---|---|---|
| 2025 | $7,768 | $708,100 | -- | -- |
| 2024 | $7,768 | $663,500 | $0 | $0 |
Landlord's Agent in 2024
Amber Krause
TTR Sotheby's International Realty
(443) 783-7244
1 in this area
27 Total Sales
Seller's Agent in 2023
Lori Gough
Long & Foster
(410) 320-0851
3 in this area
89 Total Sales
Source: Bright MLS
MLS Number: MDAA2075472
APN: 01-863-00559000
Disclaimer: Certain information contained herein is derived from information provided by parties other than Homes.com. All information provided is deemed reliable, but is not guaranteed to be accurate and should be independently verified.
![]() The data relating to real estate for sale on this website appears in part through the BRIGHT Internet Data Exchange program, a voluntary cooperative exchange of property listing data between licensed real estate brokerage firms, and is provided by BRIGHT through a licensing agreement.
The data relating to real estate for sale on this website appears in part through the BRIGHT Internet Data Exchange program, a voluntary cooperative exchange of property listing data between licensed real estate brokerage firms, and is provided by BRIGHT through a licensing agreement.
Listing information is from various brokers who participate in the Bright MLS IDX program and not all listings may be visible on the site.
The property information being provided on or through the website is for the personal, non-commercial use of consumers and such information may not be used for any purpose other than to identify prospective properties consumers may be interested in purchasing.
Some properties which appear for sale on the website may no longer be available because they are for instance, under contract, sold or are no longer being offered for sale.
Property information displayed is deemed reliable but is not guaranteed.
Copyright 2026 Bright MLS, Inc.
Ask me questions while you tour the home.