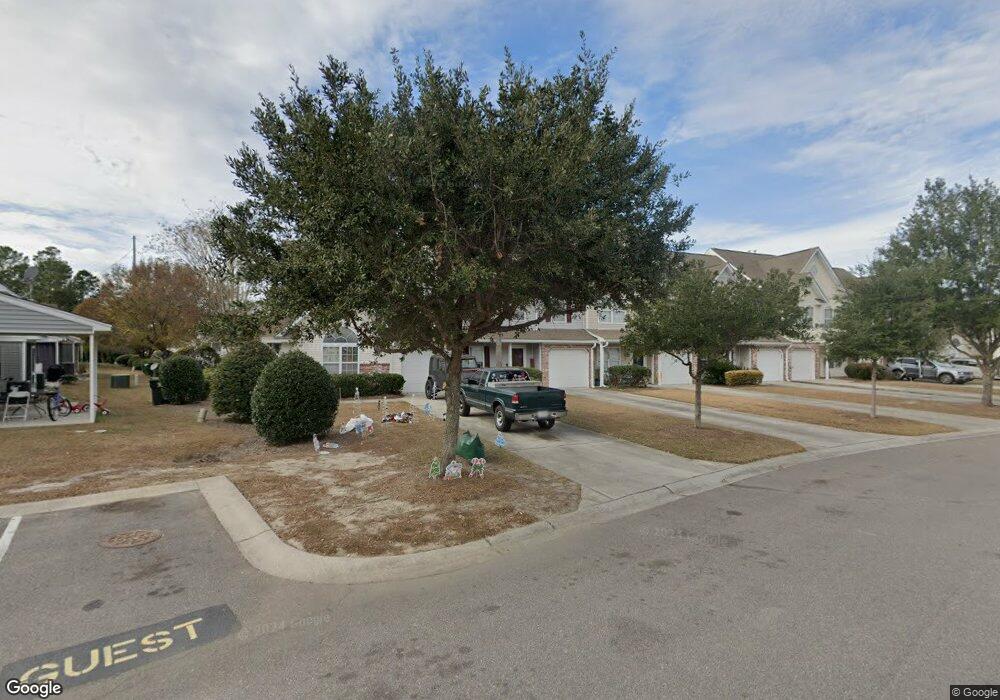
1100 Poplar Grove Place Unit 1 Summerville, SC 29483
Estimated Value: $274,000 - $293,000
3
Beds
3
Baths
1,604
Sq Ft
$176/Sq Ft
Est. Value
About This Home
This home is located at 1100 Poplar Grove Place Unit 1, Summerville, SC 29483 and is currently estimated at $283,068, approximately $176 per square foot. 1100 Poplar Grove Place Unit 1 is a home located in Berkeley County with nearby schools including Sangaree Elementary School, Sangaree Intermediate School, and Sangaree Middle School.
Ownership History
Date
Name
Owned For
Owner Type
Purchase Details
Closed on
Nov 20, 2020
Sold by
Farlow Seth C
Bought by
317 Llc
Current Estimated Value
Purchase Details
Closed on
Jan 31, 2017
Sold by
Ebinger John E and Ebinger Betty S
Bought by
Farlow Seth C
Home Financials for this Owner
Home Financials are based on the most recent Mortgage that was taken out on this home.
Original Mortgage
$149,785
Interest Rate
4.3%
Mortgage Type
VA
Purchase Details
Closed on
Mar 27, 2012
Sold by
Pnc Bank National Association
Bought by
Ebinger John E and Ebinger Betty S
Home Financials for this Owner
Home Financials are based on the most recent Mortgage that was taken out on this home.
Original Mortgage
$104,193
Interest Rate
3.89%
Mortgage Type
VA
Purchase Details
Closed on
Oct 22, 2010
Sold by
Portrait Homes Summer Wood Llc
Bought by
Rbc Bank Usa
Create a Home Valuation Report for This Property
The Home Valuation Report is an in-depth analysis detailing your home's value as well as a comparison with similar homes in the area
Home Values in the Area
Average Home Value in this Area
Purchase History
| Date | Buyer | Sale Price | Title Company |
|---|---|---|---|
| 317 Llc | $178,000 | None Available | |
| Farlow Seth C | $145,000 | None Available | |
| Ebinger John E | $102,000 | -- | |
| Rbc Bank Usa | $2,710,994 | -- |
Source: Public Records
Mortgage History
| Date | Status | Borrower | Loan Amount |
|---|---|---|---|
| Previous Owner | Farlow Seth C | $149,785 | |
| Previous Owner | Ebinger John E | $104,193 |
Source: Public Records
Tax History Compared to Growth
Tax History
| Year | Tax Paid | Tax Assessment Tax Assessment Total Assessment is a certain percentage of the fair market value that is determined by local assessors to be the total taxable value of land and additions on the property. | Land | Improvement |
|---|---|---|---|---|
| 2025 | $3,184 | $207,000 | $17,710 | $189,290 |
| 2024 | $3,139 | $12,420 | $1,063 | $11,357 |
| 2023 | $3,139 | $12,420 | $1,063 | $11,357 |
| 2022 | $3,023 | $10,800 | $552 | $10,248 |
| 2021 | $3,046 | $8,780 | $552 | $8,226 |
| 2020 | $2,531 | $8,778 | $552 | $8,226 |
| 2019 | $2,526 | $8,778 | $552 | $8,226 |
| 2018 | $2,594 | $8,508 | $552 | $7,956 |
| 2017 | $647 | $4,398 | $358 | $4,040 |
| 2016 | $661 | $4,400 | $360 | $4,040 |
| 2015 | $616 | $4,400 | $360 | $4,040 |
| 2014 | $605 | $4,400 | $360 | $4,040 |
| 2013 | -- | $4,400 | $360 | $4,040 |
Source: Public Records
Map
Nearby Homes
- 1800 Poplar Grove Place
- 1602 Poplar Grove Place
- 1402 Poplar Grove Place
- 3903 Poplar Grove Place
- 2604 Poplar Grove Place
- 103 Littlejohn St
- 500 Yellow Hawthorn Cir
- 602 Pond Pine Trail
- 195 Fox Squirrel Run
- 1304 Elm Hall Cir
- 701 Pine Bluff Dr
- 608 S Pointe Blvd
- 802 S Pointe Blvd
- 804 S Pointe Blvd
- 133 W Park Ln
- 112 True Grit Way
- 105 Limerick Cir
- 101 Limerick Cir
- 194 Dolce Ln
- 206 Eastover Cir
- 1100 Poplar Grove Place
- 1101 Poplar Grove Place
- 1102 Poplar Grove Place
- 1403 Buckthorn Cir
- 1404 Buckthorn Cir
- 1402 Buckthorn Cir
- 1103 Poplar Grove Place
- 1401 Buckthorn Cir
- 1400 Buckthorn Cir
- 1104 Poplar Grove Place
- 4401 Poplar Grove Place
- 1105 Poplar Grove Place
- 4600 Poplar Grove Place
- 4400 Poplar Grove Place
- 1203 Buckthorn Cir
- 1005 Poplar Grove Place
- 1200 Poplar Grove Place
- 1004 Poplar Grove Place
- 4601 Poplar Grove Place
- 1003 Poplar Grove Place