Estimated Value: $278,998 - $316,000
4
Beds
2
Baths
2,065
Sq Ft
$144/Sq Ft
Est. Value
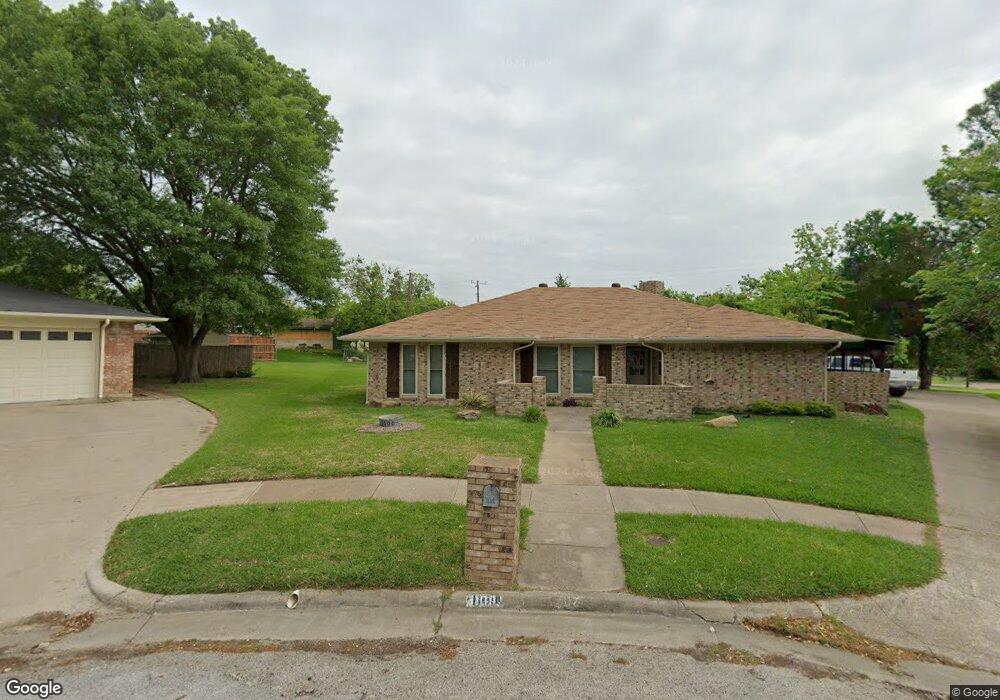
About This Home
This home is located at 1100 Scarlet Oaks Cir, Ennis, TX 75119 and is currently estimated at $297,499, approximately $144 per square foot. 1100 Scarlet Oaks Cir is a home located in Ellis County with nearby schools including Austin Elementary School, Dorie Miller Int, and Ennis Junior High School.
Ownership History
Date
Name
Owned For
Owner Type
Purchase Details
Closed on
May 14, 2021
Sold by
Mireles Aaron and Mireles Lacey Lynn
Bought by
Mireles Aaron and Mireles Lacey Lynn
Current Estimated Value
Purchase Details
Closed on
Mar 28, 2019
Sold by
Gill Logan B and Gill Rachel C
Bought by
Mireles Aaron and Mireles Lacey Lynn
Home Financials for this Owner
Home Financials are based on the most recent Mortgage that was taken out on this home.
Original Mortgage
$216,015
Outstanding Balance
$189,916
Interest Rate
4.3%
Mortgage Type
FHA
Estimated Equity
$107,583
Purchase Details
Closed on
Dec 11, 2018
Sold by
Mixon Jo Nell and Cardell Cynthia Carrie
Bought by
Ska Properties Llc
Purchase Details
Closed on
Aug 13, 2009
Sold by
Mixon Guy W and Mixon Jo Nell
Bought by
Mixon Guy W and Mixon Jo Nell
Create a Home Valuation Report for This Property
The Home Valuation Report is an in-depth analysis detailing your home's value as well as a comparison with similar homes in the area
Home Values in the Area
Average Home Value in this Area
Purchase History
| Date | Buyer | Sale Price | Title Company |
|---|---|---|---|
| Mireles Aaron | -- | None Available | |
| Mireles Aaron | -- | Fidelity National Title | |
| Ska Properties Llc | -- | None Available | |
| Mixon Guy W | -- | -- |
Source: Public Records
Mortgage History
| Date | Status | Borrower | Loan Amount |
|---|---|---|---|
| Open | Mireles Aaron | $216,015 |
Source: Public Records
Tax History Compared to Growth
Tax History
| Year | Tax Paid | Tax Assessment Tax Assessment Total Assessment is a certain percentage of the fair market value that is determined by local assessors to be the total taxable value of land and additions on the property. | Land | Improvement |
|---|---|---|---|---|
| 2025 | $4,045 | $252,268 | $65,000 | $187,268 |
| 2024 | $4,045 | $246,516 | $60,000 | $186,516 |
| 2023 | $4,045 | $261,839 | $60,000 | $201,839 |
| 2022 | $5,983 | $250,000 | $44,000 | $206,000 |
| 2021 | $6,100 | $244,350 | $35,000 | $209,350 |
| 2020 | $5,668 | $220,260 | $30,000 | $190,260 |
| 2019 | $4,175 | $166,240 | $0 | $0 |
| 2018 | $1,717 | $144,830 | $20,000 | $124,830 |
| 2017 | $3,996 | $155,070 | $18,000 | $137,070 |
| 2016 | $3,633 | $136,960 | $18,000 | $118,960 |
| 2015 | $1,732 | $135,980 | $18,000 | $117,980 |
| 2014 | $1,732 | $127,230 | $0 | $0 |
Source: Public Records
Map
Nearby Homes
- 805 Loy Ln
- 1509 Lyndale Dr
- 536 Lakeshore Dr
- 507 Lakeshore Dr
- 1103 Sunset Dr
- 3712 Kings Dr
- 2402 Country Club Rd
- 1207 Louise Ln
- 2410 Linda Dr
- 2308 Louise Ln
- 2800 Boyd St
- 1106 N Mckinney St
- 811 N Gaines St
- 905 Royse Ridge Rd
- 2900 Boyd St
- 802 N Sherman St
- 206 Houston St
- 800 N Sherman St
- 801 N Mckinney St
- 807 Williamsburg Dr
- 1104 Scarlet Oaks Cir
- 1101 Scarlet Oaks Cir
- 1103 Bluebonnet Cir
- 1101 Bluebonnet Cir
- 1106 Scarlet Oaks Cir
- 1103 Scarlet Oaks Cir
- 1105 Scarlet Oaks Cir
- 1105 Bluebonnet Cir
- 1108 Scarlet Oaks Cir
- 1200 Sundale St
- 1107 Bluebonnet Cir
- 1202 Sundale St
- 1100 Bluebonnet Cir
- 1106 Bluebonnet Cir
- 1707 Lyndale Dr
- 1705 Lyndale Dr
- 1703 Lyndale Dr
- 1204 Sundale St
- 1709 Lyndale Dr
- 1701 Lyndale Dr