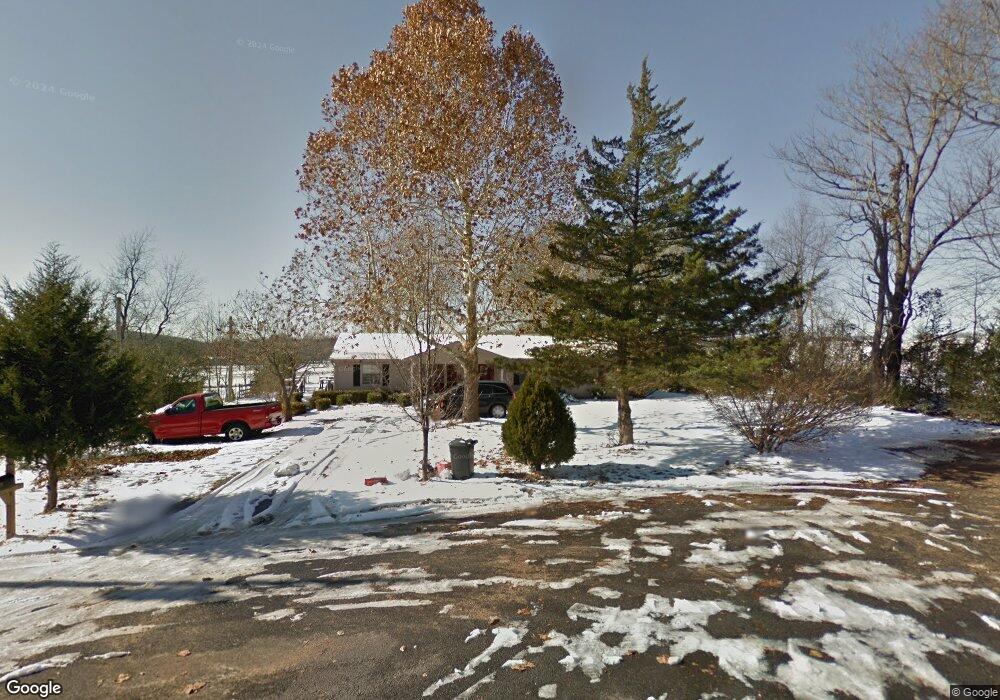
1100 Turpin Ln Tahlequah, OK 74464
Estimated Value: $163,000 - $190,000
3
Beds
2
Baths
1,296
Sq Ft
$138/Sq Ft
Est. Value
About This Home
This home is located at 1100 Turpin Ln, Tahlequah, OK 74464 and is currently estimated at $178,493, approximately $137 per square foot. 1100 Turpin Ln is a home located in Cherokee County with nearby schools including Greenwood Elementary School, Cherokee Elementary School, and Tahlequah Middle School.
Ownership History
Date
Name
Owned For
Owner Type
Purchase Details
Closed on
Apr 21, 2021
Sold by
Jones Eric and Jones Jenna
Bought by
Blair Sandra
Current Estimated Value
Home Financials for this Owner
Home Financials are based on the most recent Mortgage that was taken out on this home.
Original Mortgage
$146,464
Outstanding Balance
$132,060
Interest Rate
3.05%
Mortgage Type
New Conventional
Estimated Equity
$46,433
Purchase Details
Closed on
Aug 22, 2005
Sold by
Marshall Jeff and Marshall Cherish
Bought by
Salazar Juan M and Salazar Josefa
Home Financials for this Owner
Home Financials are based on the most recent Mortgage that was taken out on this home.
Original Mortgage
$92,263
Interest Rate
5.61%
Mortgage Type
FHA
Purchase Details
Closed on
Feb 1, 2002
Sold by
Charles and Sheila Davis
Bought by
Cherish Marshall
Purchase Details
Closed on
Feb 22, 2000
Sold by
Robert L Rea
Bought by
Charles N Davis
Create a Home Valuation Report for This Property
The Home Valuation Report is an in-depth analysis detailing your home's value as well as a comparison with similar homes in the area
Home Values in the Area
Average Home Value in this Area
Purchase History
| Date | Buyer | Sale Price | Title Company |
|---|---|---|---|
| Blair Sandra | $145,000 | Green County Abstract & Ttl | |
| Salazar Juan M | $93,000 | Tahlequah Abstract Closing S | |
| Cherish Marshall | $76,000 | -- | |
| Charles N Davis | $46,000 | -- |
Source: Public Records
Mortgage History
| Date | Status | Borrower | Loan Amount |
|---|---|---|---|
| Open | Blair Sandra | $146,464 | |
| Previous Owner | Salazar Juan M | $92,263 |
Source: Public Records
Tax History Compared to Growth
Tax History
| Year | Tax Paid | Tax Assessment Tax Assessment Total Assessment is a certain percentage of the fair market value that is determined by local assessors to be the total taxable value of land and additions on the property. | Land | Improvement |
|---|---|---|---|---|
| 2025 | $1,462 | $16,921 | $5,039 | $11,882 |
| 2024 | $1,462 | $16,428 | $4,341 | $12,087 |
| 2023 | $1,462 | $15,950 | $1,375 | $14,575 |
| 2022 | $1,387 | $15,950 | $1,375 | $14,575 |
| 2021 | $950 | $10,202 | $1,375 | $8,827 |
| 2020 | $967 | $10,201 | $1,375 | $8,826 |
| 2019 | $958 | $10,201 | $1,375 | $8,826 |
| 2018 | $970 | $10,201 | $1,375 | $8,826 |
| 2017 | $951 | $10,025 | $1,375 | $8,650 |
| 2016 | $911 | $9,547 | $1,375 | $8,172 |
| 2015 | $958 | $9,093 | $1,375 | $7,718 |
| 2014 | $958 | $10,175 | $825 | $9,350 |
Source: Public Records
Map
Nearby Homes
- TBD W Fox St
- Tbd Unit West Fox Street Tahl
- 1025 W Fox St
- 1104 Chase Ave
- 902 S Mission Ave
- 509 W 2nd St
- 516 W Fox St
- 1700 Stickross Mountain Rd
- 1500 Stickross Mountain Rd
- 813 W Choctaw St
- 807 W Choctaw St
- 0 W Choctaw St
- 513 S State Ave
- 104 S West Ave
- 802 S College Ave
- 510 S Cherokee Ave
- 821 S College Ave
- 528 S Muskogee Ave
- 1871 Stickross Mountain Rd
- 610 W Delaware St