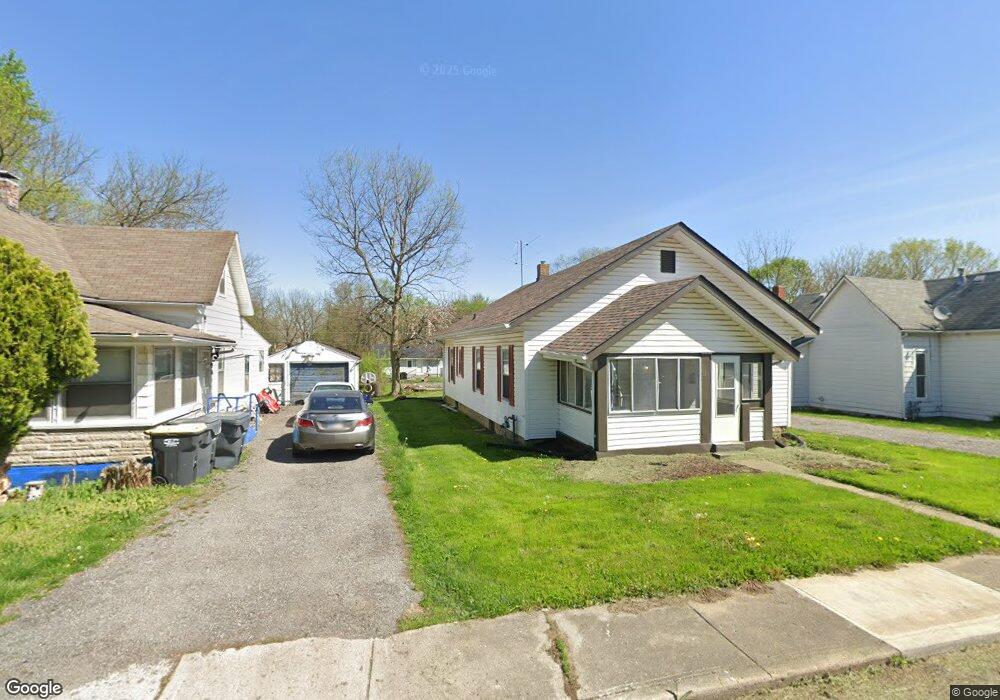
1100 W 11th St Anderson, IN 46016
Estimated Value: $97,990 - $107,000
2
Beds
1
Bath
1,232
Sq Ft
$84/Sq Ft
Est. Value
About This Home
This home is located at 1100 W 11th St, Anderson, IN 46016 and is currently estimated at $102,998, approximately $83 per square foot. 1100 W 11th St is a home located in Madison County with nearby schools including Tenth Street Elementary School, Highland Middle School, and Anderson High School.
Ownership History
Date
Name
Owned For
Owner Type
Purchase Details
Closed on
Dec 27, 2024
Sold by
Bedrock Management Llc
Bought by
Rjj In 1 Llc
Current Estimated Value
Purchase Details
Closed on
Jun 4, 2024
Sold by
Stamps Vanel C
Bought by
Bedrock Management Llc
Purchase Details
Closed on
Nov 3, 2021
Sold by
Stamps Elvan and Stamps Cathy L
Bought by
Stamps Vanel C
Purchase Details
Closed on
Jun 7, 2019
Sold by
Stamps Elvan and Stamps Cathy L
Bought by
Stamps Elvan and Stamps Cathy L
Create a Home Valuation Report for This Property
The Home Valuation Report is an in-depth analysis detailing your home's value as well as a comparison with similar homes in the area
Home Values in the Area
Average Home Value in this Area
Purchase History
| Date | Buyer | Sale Price | Title Company |
|---|---|---|---|
| Rjj In 1 Llc | -- | None Listed On Document | |
| Bedrock Management Llc | -- | None Listed On Document | |
| Stamps Vanel C | -- | None Available | |
| Stamps Elvan | -- | None Available |
Source: Public Records
Tax History Compared to Growth
Tax History
| Year | Tax Paid | Tax Assessment Tax Assessment Total Assessment is a certain percentage of the fair market value that is determined by local assessors to be the total taxable value of land and additions on the property. | Land | Improvement |
|---|---|---|---|---|
| 2024 | $1,144 | $51,500 | $4,100 | $47,400 |
| 2023 | $1,047 | $46,800 | $3,900 | $42,900 |
| 2022 | $502 | $47,300 | $3,900 | $43,400 |
| 2021 | $485 | $45,500 | $3,900 | $41,600 |
| 2020 | $931 | $41,200 | $3,700 | $37,500 |
| 2019 | $907 | $40,100 | $3,700 | $36,400 |
| 2018 | $1,148 | $36,800 | $3,700 | $33,100 |
| 2017 | $724 | $36,200 | $3,700 | $32,500 |
| 2016 | $950 | $36,200 | $3,700 | $32,500 |
| 2014 | $658 | $32,500 | $3,900 | $28,600 |
| 2013 | $658 | $32,400 | $3,900 | $28,500 |
Source: Public Records
Map
Nearby Homes
- 1027 W 11th St
- 1207 W 10th St
- 1209 Locust St
- 1019 W 9th St
- 1227 W 9th St
- 0 Hendricks St
- 1120 W 9th St
- 1425 W 9th St
- 1011 W 7th St
- 710 Henry St
- 731 W 9th St Unit Anderson
- 630 S Madison Ave
- 727 W 9th St
- 1230 W 7th St
- 1612 Hst W 10th St
- 1507 W 7th St
- 0 W 17th St
- 403 W 17th St
- 817 W 5th St
- 1421 W 5th St