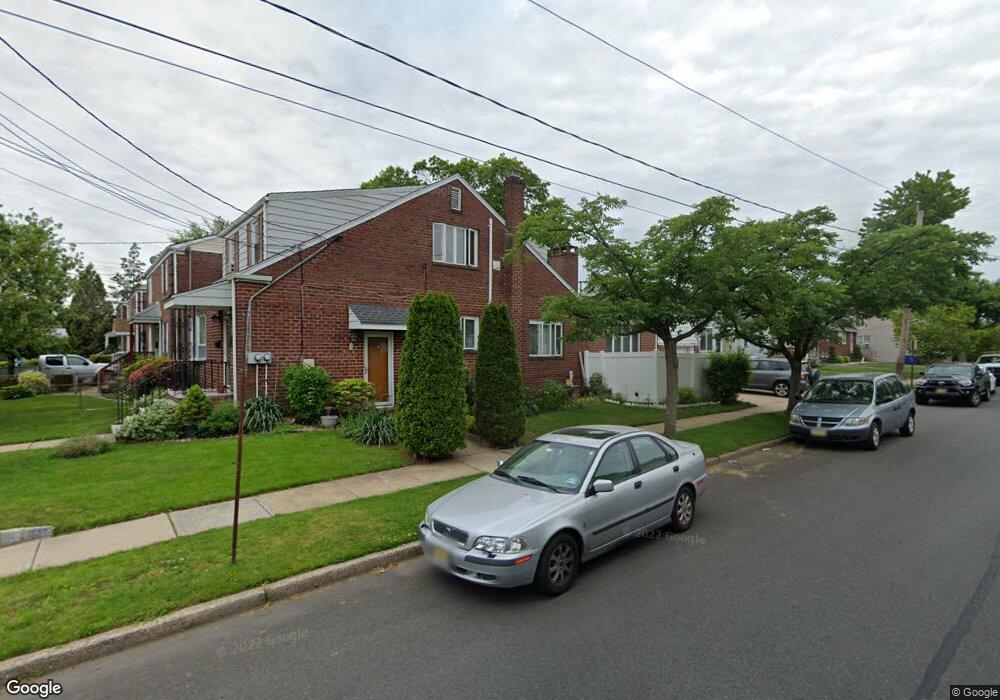
1100 W Henry St Linden, NJ 07036
Estimated Value: $599,404 - $794,000
--
Bed
--
Bath
1,539
Sq Ft
$436/Sq Ft
Est. Value
About This Home
This home is located at 1100 W Henry St, Linden, NJ 07036 and is currently estimated at $671,101, approximately $436 per square foot. 1100 W Henry St is a home located in Union County with nearby schools including School No. 8, Myles J. McManus Middle School, and Linden High School.
Ownership History
Date
Name
Owned For
Owner Type
Purchase Details
Closed on
Apr 23, 2010
Sold by
Moczerniuk Jaroslaw and Moczerniuk Gabriela
Bought by
Delia Joseph S
Current Estimated Value
Home Financials for this Owner
Home Financials are based on the most recent Mortgage that was taken out on this home.
Original Mortgage
$280,000
Outstanding Balance
$186,397
Interest Rate
4.99%
Mortgage Type
New Conventional
Estimated Equity
$484,704
Purchase Details
Closed on
Dec 14, 2005
Sold by
Petralia Pasquale
Bought by
Moczerniuk Jaroslaw and Moczerniuk Gabriela
Purchase Details
Closed on
Feb 20, 2003
Sold by
Petralia Pasquale
Bought by
Petralia Pasquale and Petralia Janina
Purchase Details
Closed on
May 31, 2000
Sold by
Lore Mildred
Bought by
Petralia Pasquale
Home Financials for this Owner
Home Financials are based on the most recent Mortgage that was taken out on this home.
Original Mortgage
$114,000
Interest Rate
7.92%
Mortgage Type
Stand Alone First
Create a Home Valuation Report for This Property
The Home Valuation Report is an in-depth analysis detailing your home's value as well as a comparison with similar homes in the area
Home Values in the Area
Average Home Value in this Area
Purchase History
| Date | Buyer | Sale Price | Title Company |
|---|---|---|---|
| Delia Joseph S | $350,000 | Multiple | |
| Moczerniuk Jaroslaw | $470,000 | -- | |
| Petralia Pasquale | $97,000 | -- | |
| Petralia Pasquale | $194,000 | Chicago Title Insurance Co |
Source: Public Records
Mortgage History
| Date | Status | Borrower | Loan Amount |
|---|---|---|---|
| Open | Delia Joseph S | $280,000 | |
| Previous Owner | Petralia Pasquale | $114,000 |
Source: Public Records
Tax History Compared to Growth
Tax History
| Year | Tax Paid | Tax Assessment Tax Assessment Total Assessment is a certain percentage of the fair market value that is determined by local assessors to be the total taxable value of land and additions on the property. | Land | Improvement |
|---|---|---|---|---|
| 2025 | $11,687 | $166,200 | $55,000 | $111,200 |
| 2024 | $11,431 | $166,200 | $55,000 | $111,200 |
| 2023 | $11,431 | $166,200 | $55,000 | $111,200 |
| 2022 | $11,491 | $166,200 | $55,000 | $111,200 |
| 2021 | $11,549 | $166,200 | $55,000 | $111,200 |
| 2020 | $11,488 | $166,200 | $55,000 | $111,200 |
| 2019 | $11,450 | $166,200 | $55,000 | $111,200 |
| 2018 | $11,446 | $166,200 | $55,000 | $111,200 |
| 2017 | $12,007 | $178,200 | $55,000 | $123,200 |
| 2016 | $11,629 | $178,200 | $55,000 | $123,200 |
| 2015 | $11,186 | $178,200 | $55,000 | $123,200 |
| 2014 | $10,968 | $178,200 | $55,000 | $123,200 |
Source: Public Records
Map
Nearby Homes
- 707 Erudo St
- 1019 W Henry St
- 706 Lindegar St
- 746 N Stiles St
- 402 W Gibbons St
- 842 Erudo St
- 600 W Henry St
- 420 Miltonia St
- 717 Summit St
- 315 Gesner St
- 419 Lafayette St
- 312 Amon Terrace
- 349 Miltonia St
- 606 Knopf St
- 1017 Karen Terrace
- 905 Dewitt St
- 435 Miner Terrace
- 906 Dewitt St
- 505 Knopf St
- 324 Dewitt St