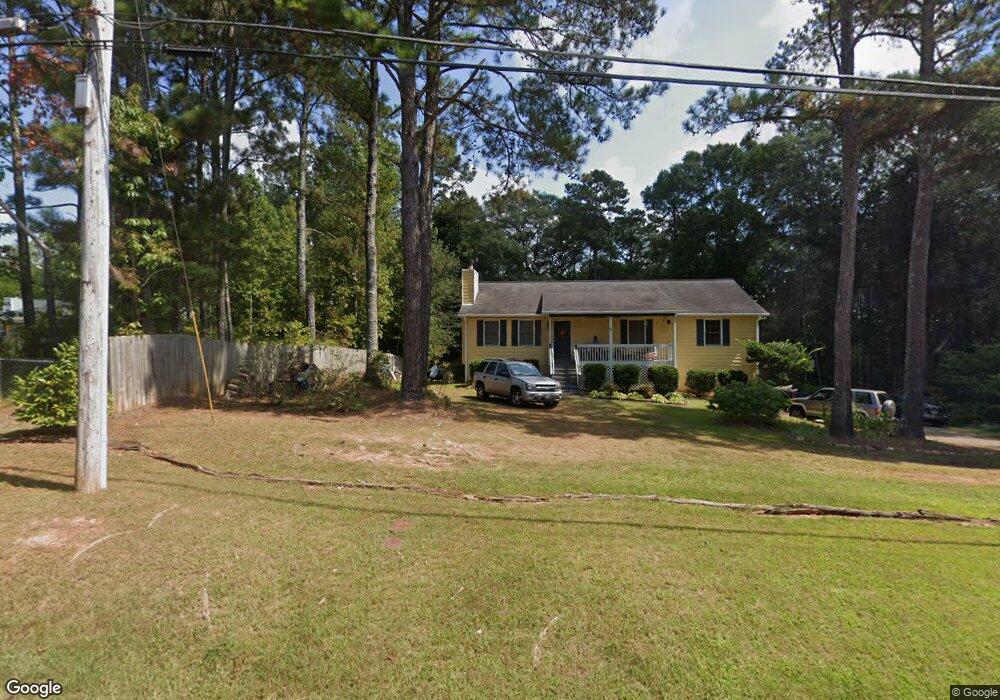
1100 Whooping Creek Rd Carrollton, GA 30116
Estimated Value: $234,000 - $270,000
3
Beds
2
Baths
1,400
Sq Ft
$182/Sq Ft
Est. Value
About This Home
This home is located at 1100 Whooping Creek Rd, Carrollton, GA 30116 and is currently estimated at $254,836, approximately $182 per square foot. 1100 Whooping Creek Rd is a home located in Carroll County with nearby schools including Central Elementary School, Central Middle School, and Central High School.
Ownership History
Date
Name
Owned For
Owner Type
Purchase Details
Closed on
Apr 7, 2006
Sold by
Not Provided
Bought by
Mixon James L and Mixon Alice J
Current Estimated Value
Purchase Details
Closed on
Oct 28, 2005
Sold by
Scott Jimmy L and Scott Jennifer L
Bought by
Mixon James L and Mixon Alice I
Home Financials for this Owner
Home Financials are based on the most recent Mortgage that was taken out on this home.
Original Mortgage
$114,991
Interest Rate
5.84%
Mortgage Type
FHA
Purchase Details
Closed on
Jul 3, 2002
Sold by
Scott Jimmy L
Bought by
Scott Jimmy L and Scott Jennifer L
Purchase Details
Closed on
Nov 28, 1996
Sold by
Fulford James R
Bought by
Ledbetter Jbret and Ledbetter Reg
Purchase Details
Closed on
Nov 22, 1996
Sold by
Ledbetter Jbret and Ledbetter Reg
Bought by
Duncan Michael K
Purchase Details
Closed on
Jan 26, 1996
Sold by
Ledbetter
Bought by
Fulford James R
Purchase Details
Closed on
Aug 23, 1991
Bought by
Ledbetter
Create a Home Valuation Report for This Property
The Home Valuation Report is an in-depth analysis detailing your home's value as well as a comparison with similar homes in the area
Home Values in the Area
Average Home Value in this Area
Purchase History
| Date | Buyer | Sale Price | Title Company |
|---|---|---|---|
| Mixon James L | -- | -- | |
| Mixon James L | $115,900 | -- | |
| Scott Jimmy L | -- | -- | |
| Scott Jimmy L | $109,000 | -- | |
| Ledbetter Jbret | -- | -- | |
| Duncan Michael K | $77,300 | -- | |
| Fulford James R | $398,700 | -- | |
| Ledbetter | -- | -- |
Source: Public Records
Mortgage History
| Date | Status | Borrower | Loan Amount |
|---|---|---|---|
| Previous Owner | Mixon James L | $114,991 |
Source: Public Records
Tax History Compared to Growth
Tax History
| Year | Tax Paid | Tax Assessment Tax Assessment Total Assessment is a certain percentage of the fair market value that is determined by local assessors to be the total taxable value of land and additions on the property. | Land | Improvement |
|---|---|---|---|---|
| 2025 | $1,274 | $68,000 | $9,284 | $58,716 |
| 2024 | $1,288 | $68,000 | $9,284 | $58,716 |
| 2023 | $1,288 | $71,393 | $8,709 | $62,684 |
| 2022 | $1,207 | $56,121 | $5,806 | $50,315 |
| 2021 | $1,197 | $47,831 | $4,645 | $43,186 |
| 2020 | $1,362 | $51,327 | $4,445 | $46,882 |
| 2019 | $1,087 | $47,378 | $4,445 | $42,933 |
| 2018 | $998 | $42,008 | $4,154 | $37,854 |
| 2017 | $1,001 | $42,008 | $4,154 | $37,854 |
| 2016 | $1,002 | $42,008 | $4,154 | $37,854 |
| 2015 | $1,088 | $42,909 | $6,600 | $36,309 |
| 2014 | $1,093 | $42,909 | $6,600 | $36,309 |
Source: Public Records
Map
Nearby Homes
- 1001 Whooping Creek Rd
- 1233 Whooping Creek Rd
- 1430 Whooping Creek Church Rd
- 1450 Whooping Creek Church Rd
- 1502 Whooping Creek Church Rd
- 1512 Whooping Creek Church Rd
- 587 Whooping Creek Rd
- 1915 Whooping Creek Church Rd
- 1837 Whooping Creek Rd
- 472 Carrie Kathleen Terrace
- 197 Westbrook Rd
- 221 Valley Ridge Dr
- 977 Whooping Creek Rd
- 703 Central High Rd
- 184 Whooping Creek Church Rd
- 213 Shady Valley Dr
- 143 Oak Leaf Dr Unit 163
- 143 Oak Leaf Dr
- 113 Red Oak Ln
- 185 White Oak Ct
- 1051 Whooping Creek Rd
- 1127 Whooping Creek Rd
- 1028 Whooping Creek Rd
- 1001 Whooping Creek Rd Unit 6
- 1014 Whooping Creek Rd
- 1153 Whooping Creek Rd
- 1002 Whooping Creek Rd
- 988 Whooping Creek Rd
- 830 Whooping Creek Rd
- 972 Whooping Creek Rd
- 1200 Whooping Creek Rd
- 963 Whooping Creek Rd
- 960 Whooping Creek Rd
- 949 Whooping Creek Rd
- 946 Whooping Creek Rd
- 1248 Whooping Creek Rd
- 935 Whooping Creek Rd
- 930 Whooping Creek Rd
- 914 Whooping Creek Rd
- 927 Whooping Creek Rd