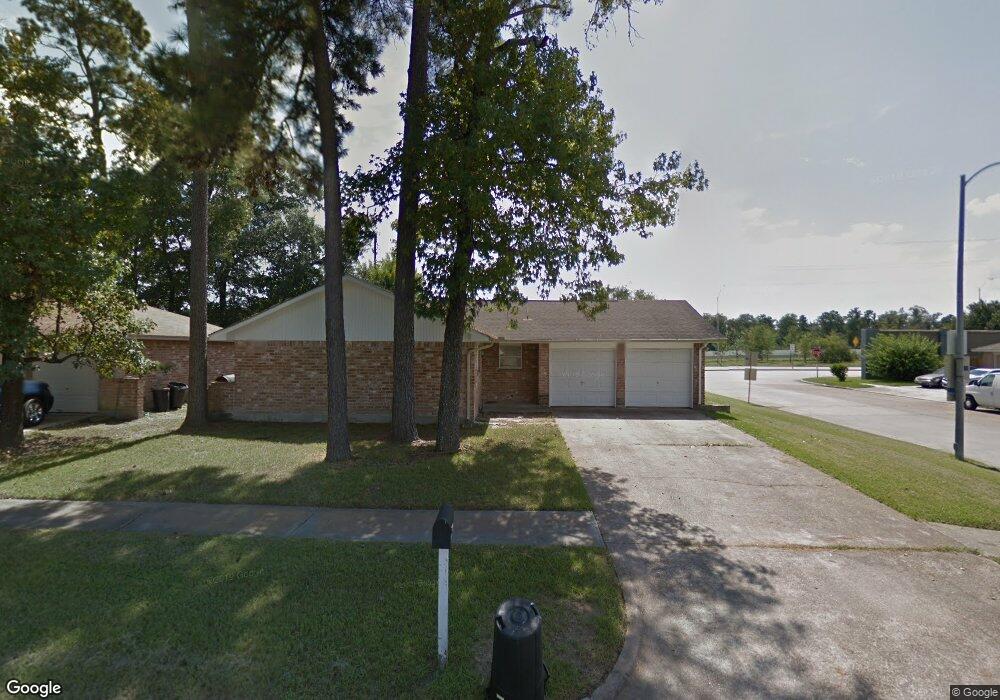
11002 Clear Fork Dr Humble, TX 77396
Estimated Value: $171,000 - $196,000
3
Beds
2
Baths
1,062
Sq Ft
$172/Sq Ft
Est. Value
About This Home
This home is located at 11002 Clear Fork Dr, Humble, TX 77396 and is currently estimated at $183,025, approximately $172 per square foot. 11002 Clear Fork Dr is a home located in Harris County with nearby schools including Ridge Creek Elementary, Middle #10, and Summer Creek High School.
Ownership History
Date
Name
Owned For
Owner Type
Purchase Details
Closed on
Nov 28, 2008
Sold by
Secretary Of Veterans Affairs
Bought by
Gutierrez Rumaldo and Acevedo Elviah
Current Estimated Value
Purchase Details
Closed on
Jun 19, 2008
Sold by
Bank Of New York
Bought by
Va
Purchase Details
Closed on
May 6, 2008
Sold by
Ubias Joe M and Ubias Sonia V
Bought by
Bank Of New York and Certificate Holders Of Asset Backed Cert
Purchase Details
Closed on
Jul 16, 2002
Sold by
Konrath Jeffrey Dennis and Konrath Kim Renee
Bought by
Ubias Joe M and Ubias Sonia
Home Financials for this Owner
Home Financials are based on the most recent Mortgage that was taken out on this home.
Original Mortgage
$62,319
Interest Rate
6.73%
Mortgage Type
VA
Create a Home Valuation Report for This Property
The Home Valuation Report is an in-depth analysis detailing your home's value as well as a comparison with similar homes in the area
Home Values in the Area
Average Home Value in this Area
Purchase History
| Date | Buyer | Sale Price | Title Company |
|---|---|---|---|
| Gutierrez Rumaldo | -- | First American Title | |
| Va | -- | None Available | |
| Bank Of New York | $56,403 | None Available | |
| Ubias Joe M | -- | Commonwealth Land Title Co | |
| Konrath Jeffrey Dennis | -- | Commonwealth Land Title Co |
Source: Public Records
Mortgage History
| Date | Status | Borrower | Loan Amount |
|---|---|---|---|
| Previous Owner | Ubias Joe M | $62,319 |
Source: Public Records
Tax History Compared to Growth
Tax History
| Year | Tax Paid | Tax Assessment Tax Assessment Total Assessment is a certain percentage of the fair market value that is determined by local assessors to be the total taxable value of land and additions on the property. | Land | Improvement |
|---|---|---|---|---|
| 2025 | $4,371 | $152,693 | $38,430 | $114,263 |
| 2024 | $4,371 | $158,060 | $38,430 | $119,630 |
| 2023 | $4,371 | $154,974 | $38,430 | $116,544 |
| 2022 | $3,913 | $133,281 | $38,430 | $94,851 |
| 2021 | $3,417 | $111,401 | $38,430 | $72,971 |
| 2020 | $3,437 | $107,992 | $38,430 | $69,562 |
| 2019 | $3,170 | $95,411 | $25,620 | $69,791 |
| 2018 | $1,318 | $86,723 | $14,091 | $72,632 |
| 2017 | $2,916 | $86,723 | $14,091 | $72,632 |
| 2016 | $2,571 | $76,450 | $14,091 | $62,359 |
| 2015 | $1,996 | $68,445 | $14,091 | $54,354 |
| 2014 | $1,996 | $58,136 | $14,091 | $44,045 |
Source: Public Records
Map
Nearby Homes
- 10915 Clear Fork Dr
- 11111 Clear Fork Dr
- 11019 Drakeland Dr
- 10910 Drakeland Dr
- 11123 Drakeland Dr
- 10826 Thorncliff Dr
- 15026 Sunset Creek Dr
- 15203 Albert Oak Dr
- 15214 Central Lakes Dr
- 15019 Silhouette Ridge Dr
- 10515 Kentington Oak Dr
- 10731 Spring Brook Pass Dr
- 15031 Arizona Sky Ct
- 15302 Albert Oak Dr
- 15318 Central Lakes Dr
- 10518 Sun River Falls Dr
- 11002 Hillside Creek Dr
- 11034 Hillside Creek Dr
- 11042 Hillside Creek Dr
- 11122 Hillside Creek Dr
- 11006 Clear Fork Dr
- 11010 Clear Fork Dr
- 10926 Clear Fork Dr
- 11003 Clear Fork Dr
- 10935 Clear Fork Dr
- 11014 Clear Fork Dr
- 11007 Clear Fork Dr
- 10931 Clear Fork Dr
- 10922 Clear Fork Dr
- 11011 Clear Fork Dr
- 10927 Clear Fork Dr
- 11018 Clear Fork Dr
- 10918 Clear Fork Dr
- 11015 Clear Fork Dr
- 11004 Maple Rock Dr
- 10923 Clear Fork Dr
- 11006 Maple Rock Dr
- 11002 Maple Rock Dr
- 11010 Maple Rock Dr
- 10930 Maple Rock Dr