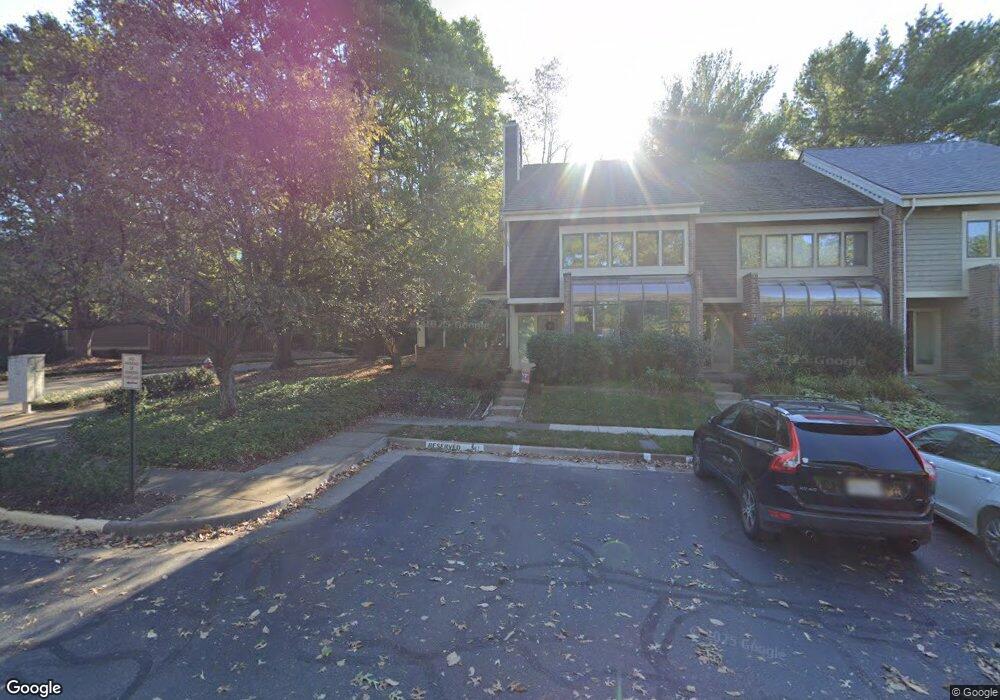
11003 Thrush Ridge Rd Reston, VA 20191
Estimated Value: $679,000 - $769,000
3
Beds
3
Baths
1,873
Sq Ft
$375/Sq Ft
Est. Value
About This Home
This home is located at 11003 Thrush Ridge Rd, Reston, VA 20191 and is currently estimated at $702,965, approximately $375 per square foot. 11003 Thrush Ridge Rd is a home located in Fairfax County with nearby schools including Sunrise Valley Elementary, Langston Hughes Middle School, and South Lakes High School.
Ownership History
Date
Name
Owned For
Owner Type
Purchase Details
Closed on
Dec 15, 2010
Sold by
Renner Philip M and Collier Melissa K
Bought by
Orend Zachary D
Current Estimated Value
Home Financials for this Owner
Home Financials are based on the most recent Mortgage that was taken out on this home.
Original Mortgage
$266,100
Outstanding Balance
$175,897
Interest Rate
4.23%
Mortgage Type
New Conventional
Estimated Equity
$527,068
Purchase Details
Closed on
Jan 28, 2000
Sold by
Maizel Margaret S
Bought by
Renner Philip M
Home Financials for this Owner
Home Financials are based on the most recent Mortgage that was taken out on this home.
Original Mortgage
$168,000
Interest Rate
7.98%
Purchase Details
Closed on
Oct 31, 1995
Sold by
Arnold Kimberly S
Bought by
Maizel Margaret S
Home Financials for this Owner
Home Financials are based on the most recent Mortgage that was taken out on this home.
Original Mortgage
$150,300
Interest Rate
7.6%
Create a Home Valuation Report for This Property
The Home Valuation Report is an in-depth analysis detailing your home's value as well as a comparison with similar homes in the area
Home Values in the Area
Average Home Value in this Area
Purchase History
| Date | Buyer | Sale Price | Title Company |
|---|---|---|---|
| Orend Zachary D | $369,000 | -- | |
| Renner Philip M | $210,000 | -- | |
| Maizel Margaret S | $167,000 | -- |
Source: Public Records
Mortgage History
| Date | Status | Borrower | Loan Amount |
|---|---|---|---|
| Open | Orend Zachary D | $266,100 | |
| Previous Owner | Renner Philip M | $168,000 | |
| Previous Owner | Maizel Margaret S | $150,300 |
Source: Public Records
Tax History
| Year | Tax Paid | Tax Assessment Tax Assessment Total Assessment is a certain percentage of the fair market value that is determined by local assessors to be the total taxable value of land and additions on the property. | Land | Improvement |
|---|---|---|---|---|
| 2025 | $6,809 | $596,970 | $205,000 | $391,970 |
| 2024 | $6,809 | $564,790 | $205,000 | $359,790 |
| 2023 | $6,566 | $558,570 | $205,000 | $353,570 |
| 2022 | $6,369 | $534,970 | $195,000 | $339,970 |
| 2021 | $6,163 | $504,970 | $165,000 | $339,970 |
| 2020 | $6,068 | $493,170 | $165,000 | $328,170 |
| 2019 | $5,896 | $479,150 | $165,000 | $314,150 |
| 2018 | $5,338 | $464,150 | $150,000 | $314,150 |
| 2017 | $5,607 | $464,150 | $150,000 | $314,150 |
| 2016 | $5,673 | $470,560 | $150,000 | $320,560 |
Source: Public Records
Map
Nearby Homes
- 11144 Beaver Trail Ct Unit 11144
- 11116 Beaver Trail Ct Unit 11116
- 11168 Beaver Trail Ct
- 10929 Howland Dr
- 11117 Little Compton Dr
- 10900 Hunter Station Rd
- 2261 Cedar Cove Ct
- 10921 Harpers Square Ct
- 11240 Harbor Ct Unit 11240
- 11203 Leatherwood Dr
- 1951 Sagewood Ln Unit 619
- 1953 Lakeport Way
- 11123 Lakespray Way
- 1926 Lakeport Way
- 2012 Swans Neck Way
- 1840 Post Oak Trail
- 1806 Cranberry Ln
- 2006 Headlands Cir
- 11566 Rolling Green Ct Unit 12/200A
- 2111 Lirio Ct
- 11005 Thrush Ridge Rd
- 11007 Thrush Ridge Rd
- 11001 Thrush Ridge Rd
- 11011 Thrush Ridge Rd
- 10999 Thrush Ridge Rd
- 11013 Thrush Ridge Rd
- 10997 Thrush Ridge Rd
- 11016 Thrush Ridge Rd
- 11014 Thrush Ridge Rd
- 11018 Thrush Ridge Rd
- 10995 Thrush Ridge Rd
- 11015 Thrush Ridge Rd
- 11020 Thrush Ridge Rd
- 11012 Thrush Ridge Rd
- 11022 Thrush Ridge Rd
- 11030 Thrush Ridge Rd
- 11032 Thrush Ridge Rd
- 10993 Thrush Ridge Rd
- 11028 Thrush Ridge Rd
- 11017 Thrush Ridge Rd
Your Personal Tour Guide
Ask me questions while you tour the home.